2023年8月15日星期二

Metro Radio 新城財經台【新城地產街】20230812

載於2023年08月12日 【Metro Radio 新城地產街】 

主題: 

》今年上半年樓市整體表現如何?樓價走勢如何?目前一二手樓價走勢?交投情況?

》經濟環境與樓市關係?

》近日發展商都積極推售新盤,而個別發展商推售私樓時價以貼近居屋價出售,當中又有何反映?市民會如何選擇?參考咩因素?

》政策走向?政府早前有放寬物業的按揭成數,但就未有撤辣,未來政策走向如何?

嘉賓: 

Bricks & Mortar Management 主席兼總裁 王震宇

美聯首席分析師 劉嘉輝

嘉賓主持: 

理大建築及房地產學系教授 許智文


新城連結:Bricks & Mortar Management 主席兼總裁王震宇


2023年8月8日星期二

房策萬箭齊發 樓市無所適從?20230808

本文亦於2023年8月8日在【信報】刊登: 房策萬箭齊發 樓市無所適從?

最近數年,政府在房屋政策上動作多多,繼行政長官李家超於2022年《施政報告》提出「簡約公屋」,之後再於今年《施政報告》提出重啟私人參建居屋(樂建居),令此早已在2002年廢棄之計劃重新復活。除此之外,政府亦開展過渡性社會房屋,如此花多眼亂,到底是勵精圖治還是畫蛇添足?

樓市升勢越勁 干預引誘越強

筆者在此將過去六十年的重要公營房屋政策全面排列,希望將因果相配,使讀者更易明白各項政策動作背後的動機及時機。結果不難發現凡是政策雜亂紛陳的時間,往往就是樓價大幅飆升(【圖一】棕色箭嘴)或下跌(綠色箭嘴)之後,例如:

1977年居屋/私人參建計劃推出時(見箭嘴A)乃在1971-1976年樓價上升133%之後(樓價線上虛線1後);繼之,中等入息房屋於1980年推出亦正值樓市上升期尾段(虛線2),其後卻遇上樓市急升後(虛線3)的下降周期所以到1984年就匆匆取消(箭嘴B);

圖一:香港歷年公營房屋計劃時間綫梳理

同樣地,1985-1994年間樓價繼續猛升(虛線4),催化了另外幾個新的房屋計劃(自貸、夾屋,見箭嘴C-D),以及97年泡沫爆破前(虛線5)急就章推出的租置、可租可買等計劃(見箭嘴E)。只有當樓市大崩潰後價格觸及沙士底部前後,政府才於2002年慌忙撤招,先後取消了五項房屋干預措施之多(箭嘴F)!

2003年後,風水輪流轉,樓市上升周期再度重臨(虛線6+7),政府再度迫於形勢,在政治壓力高漲之下,忍不住手,相繼推出數度新嘅干預措施如置安心、實而不華居屋之流(箭嘴G+H)。

然而,環球零息環境下,樓價毫無下調的跡象,繼續衝高至2021/2022年三頂高位,政府期間正是扭盡六壬,招式不停:先推綠置居白居二,再出新的簡屋/樂建居/過渡性房屋之流(箭嘴I),絕對印證了頭痛醫頭腳痛醫腳的短視房策哲學,完全沒有全盤住房福利管理的影子,實在令人失望。

於今,政府房策的魔咒再度應驗:每當新政紛呈那刻,就是樓市轉勢之時:行文之際樓價已由21年9月高位下跌12%。恐怕不出兩年,又會在下一個循環底部重蹈托私樓/廢公營的覆轍(箭嘴J)?

為更易顯示以上理論,筆者將政策動力的源頭(即私樓樓價,見【圖二】藍線),及因之而釋出的政治壓力(即輪候上樓時間,見綠線)繪於政府各項干預措施數目(見紅線)的同一時間軸上,可以見到各線之相關性極為明顯,兼且時序非常吻合:

圖二:樓價高低影響公屋輪候時間長短,亦直接推動政府在房屋計劃上插手的多寡


總體來看,公營屋計劃的數量(即干預市場的頻率)基本跟隨輪候時間升跌;而後者當然是申請人用行動反映樓價高低時人心於貪婪與恐懼之間搖擺的一面鏡!上圖亦可預示:隨著樓價回落持續(藍線),過去一段時間累積的輪候需求亦因而消退;隨之而來的亦是政府各項計劃於2025-7年間逐步退出的結局。

另一可由上圖一窺的常規,則是:政府政策永遠落後於形勢,由藍線的滯後時間來看,通常政策上的遠水大約遲於樓市上的近火3-4年時間!

深圳後來居上 福利簡潔易明

在住房福利上香港一直被既得利益團體把持騎劫,令到政出多門,互打嘴巴。反觀一河之隔的深圳,卻佈局簡單,將階梯一分為三,與私樓重複度小,令福利能真的精準投放,簡直令人耳目一新:

圖三:深圳歷年公營房屋計劃時間綫梳理

就算深圳各住屋計劃亦有如香港般受高樓價推動(見箭嘴a—c),但是該地在推出新計劃之際會同時取消已過時的舊福利,令用家能所適從,而非香港式的受眾眼花瞭亂,管者手忙腳亂。

再舉例對照:深圳2023年計劃供應分配保障性住房8萬間(建築面積約4百萬平方米)和私樓6萬間(約6百萬平方米),公:私住房數量與建築面積的比例分別爲4:3和4:6,相較香港矯枉過正的七:三比例,深圳房地產市場更加「自由」!

政策反璞歸真:廢居屋,減公屋

自1965年以來,香港共推出18項公營房屋計劃,其中10項仍在運行【圖一】,然而房屋問題越搞越僵,不但公屋政策廣泛被批評加劇供不應求,兼且造成公屋越多反而「窮人」、「懶人」越多的畸形怪象;不但不利社會階層向上流動,更浪費巨大的社會資源。

有見於此,政府實應盡早實施徹底的改革,將所有居屋供應推向私人市場,既保障充足供應,亦可令樓價急速回順。同時將公屋範圍真正局限於有福利需要的最弱勢一群市民(而非當今35%總存量!),令更多的供應由私人市場提供,只要所有新樓供應皆可投向自由租務市場,租金亦有機會合理化而無須政府赤膊上陣,事事上下其手反而事與願違……

圖四:香港現有房屋福利——架床疊屋,臃腫無效:市場角色逐漸式微

圖五:理順後的房屋福利:政府專注安全網,市場主導房屋經濟

只要有信心讓市場調配供求及價格,【圖四】這樣的爛攤子就無再存在的理由,政府未來的福利政策就真真正正回歸基本——只提供最基本的福利網(【圖五】紅區)所需實物房屋,就算真的要加大福利覆蓋,亦只需以租金券形式令受眾在自由市場與適合的時候尋找適合地區內適合大小的居所,從此擺脫官僚膨脹,流動性呆滯,及福利不公的現狀,實乃香港之福。

真正靈活、有效、及公平的公營房屋佔比絕非越多越好,如現行政策下之7:3比(即【圖六】紅箭嘴所趨),而是在盡少干預下回歸基本步的以底層安全網(約在綠箭嘴以下)為本,金錢資助為輔(即租金券)之架構。否則香港只會被人取笑東施效顰,樣樣追趕星加坡,而同時卻比弟弟深圳遠遠拋離!

圖六:公營房屋比例再度抽升,實非市民之福…

行文至此,順帶重新連結往年房屋政策相關文章,再次拋磚引玉:

香港公營房屋:改革一日不行 誇張報道無終 2022年5月》(博客領英)

公營房屋膨脹無盡干預毒癮欲罷不能 2021年11月》(網站博客領英)

公屋改革面面觀─公屋「豪宅化」 2014年10月》(網站博客)

公屋改革面面觀─結構性自我膨脹 2014年9月》(網站博客)

居屋政策 好心做壞事 2014年7月》(網站博客)


筆者特別鳴謝中文大學國際商務與中國企業系學生曾鈺嶸協助收集及整理本文相關數據及圖表。

Is retail ownership too big-developer heavy? Should land sales encourage strata disposal? 20230808

When dining out, will you head for Ladies’ Market/Temple Street or Langham Place/MOKO? What about choosing between Tang Lung Street/Yiu Wah Street or Hysan Place/Time Square? The answers to these questions hint at the preferences in the shopping for the highly fragmented but competitive market on the one hand, and a curated but selective offering on the other. This phenomenon in Hong Kong’s retail landscape is the result of how the government approaches land sales in recent years: the creation of ever larger shopping complexes while premise choices for end users (i.e. retail operators) diminish.

This hypothesis appears to be corroborated when plotting the stock of retail Gross Floor Area (GFA) in the past 20 years and what market share is made up by the portfolios of the seven major developers (referred to later as the “major players”, including Sun Hung Kai, Henderson, Cheung Kong, Sino, New World, Hang Lung, and Swire): as shown in Chart 1, the major players’ weighting has been steadily rising year after year, except for 2006, when there was a large completion in the overall stock which lowered the ratio, and 2011, when Swire sold Cityplaza leading to a drop in the ratio:

Chart 1: Major players’ share of retail space has been steadily rising

The seven major players have seen their share of Hong Kong retail GFA from 23.8% in 2001 to 25.8% in 2022, and this rise has been accompanied by a meaningful increase in overall retail inventory (which grew by 26.5 million sq ft, or 27%, to 125.9 million sq ft).

Bigger land sites benefit large developers in land sales

Why can the major players acquire increasing shares of retail lands? Is it because there are fewer and fewer small property developers? Or is it because the rising complexity of retail property development is becoming so intimidating that even new large developers from the Mainland – who have been making waves in HK recently – opted to stay on the sidelines?

A look at the long-term trend of the size of land lots sold provides a possible explanation: from 1990 to 2022, the average floor area of pure commercial sites sold by the government has been progressively rising, doubling from 300,000 sq ft levels in 1991 to 600,000 sq ft in 2022 (see blue line and blue dotted line in Chart 2). On top of that, the highest average floor area of commercial sites sold was also reached in 2019, at 1.6 million square feet:

Chart 2: The expanding size of commercial land sold, coupled with rising property prices raises entry barrier to prohibitive levels

Meanwhile, as retail property prices climb, the capital investment required from developers escalates even faster (see red and red-dotted trend lines in the chart above), making it difficult for small developers to compete, thus allowing the major players to build their retail empires.

Moreover, even if we adjusted the red line by the Hang Seng Properties Index (HSNP) to factor in funding capabilities of listed developers, the same conclusion can be reached: the ever growing size of land parcels sold increasingly disqualifies even small listed companies, as the market cap adjusted development capital soars at a exponential rate (green line/green dotted line).

Well-known and old brands more likely own their premises

This trend of retail space increasingly concentrated in the hands of major players seem to be the result of years of government land sale practice. Even if this outcome is not official policy, the objective result is that small shops are excluded from owning their own premises. 

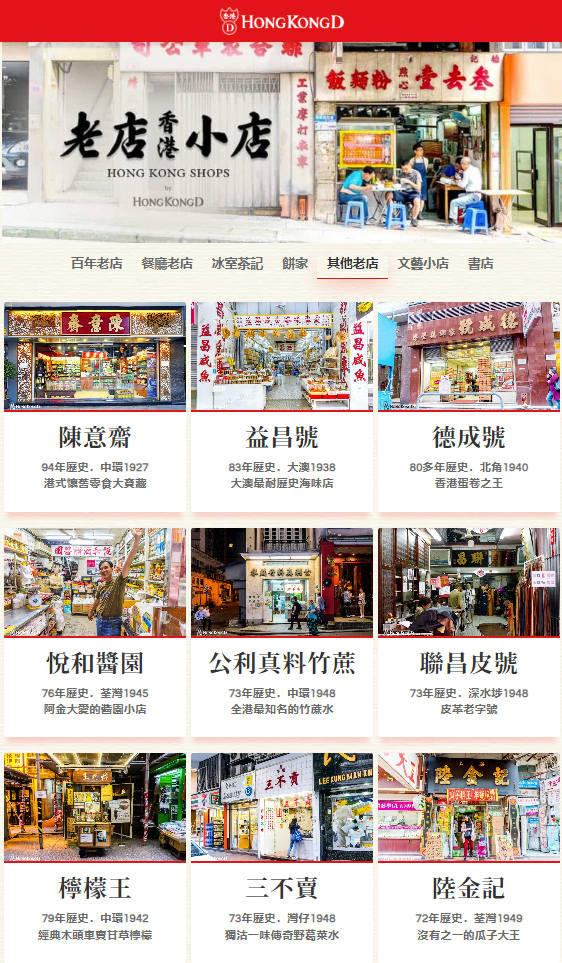
Imagine that land sale conditions stipulate that certain portions of retail sites must be sold as strata title, would that help create a community alive with innovative brands or specialty shops which do not have the pressure to maximise revenue in order just to pay their monthly rent? Assuming such shops need 1,000 sq ft of floor space each, and given that a 560,000 sq ft of floor space has been sold annually by the government (blue line in Chart 2) over the past 30 years, could we have helped at least 170,000 entrepreneurs realise their creative ambitions, and generate long-term wealth through the development of unique products and brands? Figure 1 and 2 are good examples of how rich and diverse (though not necessarily super profitable) brand fabric in Hong Kong’s commercial past may have indeed grown from the soils of pressure free premise ownership:

Figure 1: Century-old stores mostly own their premises outright


Figure 2: Other historic stores also rarely seen in major shopping malls

Source:https://www.hongkongd.com/hk-shops/

Mega mall proliferation breeds endless chain brands

The result of the increasing prevalence of large shopping malls alongside retail property ownership concentration not only makes it hard for small specialty stores to compete, but creates a retail scene dominated by well-known chain stores and an almost universally homogenous shopping experience. Let us quantify this issue with some charts:

Observation 1: The larger the average size of shops, the higher the degree of brand duplication in the shopping malls. Chart 3 correlates the distribution of brand overlap between seven pairs of shopping malls (all are leading Hong Kong malls in various categories: e.g. New Town Plaza in Shatin as a community mall, or Langham Place the destination malls group) and the average shop size; remarkably, the bigger the average shop floor area, the higher the overlap tenants between the pair of malls:

Chart 3: Brand duplications is closely correlated with the average floor area of shops within each mall pair

From another perspective, the highest duplication rates were found:

In the community malls group (44% for YOHO malls and Shatin New Town Plaza, Chart 4), probably due to these malls serving sizeable local populations with more homogeneous consumption patterns, they attract largely similar brands as tenants.

In the luxury shopping malls group (43% for International Finance Centre at Hong Kong Station and The Elements at Kowloon Station), again, serving high-end luxury clientele who buy largely similar brands such as Louis Vuitton and Gucci, limiting the variety of tenants these malls can choose from!

At the other extreme sits the group of highly strata titled malls (at a shocking 1% brand overlap, this group is paired between Sceneway Plaza in Lam Tin with a highly fragmented ownership profile and New Town Plaza, a single ownership mega mall); the former has had very dispersed ownership for a long time, and the stores inside have further been subdivided to tiny sizes (at average size of about 800 sq ft, it is 80% less than those of New Town Plaza coming in at 4,770 sq ft), no wonder Sceneway Plaza has very high footfalls, and has a very thriving vibe one finds in open bazaars:

Chart 4: Strata titled malls have more shops and more variety, leading to less repetitive shopping experience

In conclusion, whether we desire dispersed wealth among the populace (as small shop property owners) or strong autonomy of the retail outlets, or increasing choice and affordability for the shopping public, perhaps the government should give consideration to the economic and social benefits of strata title retail ownership after land sales, instead of just planning convenience and procedural expediency from a bureaucratic angle? 

Aside from these micro benefits, having greater economic resilience and diversity, as well as enlarging the middle class are potential further benefits of the government cutting up land sale lots and adding a mix of strata title into its sale mandates. The final added reputation bonus would be less perception that there is some sort of ‘land collusion’ game going on in the HK property market.

The author would like to thank Tang Chin Chung from The University of Hong Kong majoring in Surveying for assisting in data collection, analysis, and drafting of this article.


2023年8月4日星期五

Too much policy meddling trashes HK housing market 20230804

The SAR government’s launches of new housing policies have reached fever pitch in recent years: from Chief Executive Lee’s “Light Public Housing (LPH)” initiative from his 2022 Policy Address to this year’s resumption of “Private Sector Participation Scheme (PSPS)” that was abandoned in 2002, to the launch of Transitional Housing (TH)… All this begs the question of whether the government has a well laid plan for the long term, or just reacting furiously to show it is doing something to the rising home prices (which has now turned down)?

The stronger the price rises, the bigger the temptation to interfere

Your correspondent has charted all the major public housing initiatives of the past 60 years so as to demonstrate cause and effect, and to illustrate the motives and timing of their launches. The result is clear: whenever major tinkering is made to housing policies, it is often after sharp surges (see brown arrows in Chart 1) or falls (green arrows) in home prices, for example:

a)      The introduction in 1977 of the Home Ownership Scheme (HOS) / PSPS (brown arrow A) was after some 133% rise in home prices between 1971 and 1976 (see dotted line 1 on the property price line); this was followed by

b)      The Middle Income Housing launch in 1980 coinciding with the end of another period of strong price increases (dotted line 2), but then hastily cancelled in 1984 (green arrow B) when the upcycle turned downwards after a final surge towards the 1981 peak (dotted line 3); likewise,

Chart 1: A timeline of Hong Kong’s major public housing schemes changes

a)      The continued home price surge between 1985 and 1994, catalysed several further housing schemes (Home Purchase Loan Scheme, Sandwich Class Housing, see brown arrows C-D), as well as the final blast to mark the peak: the Tenants Purchase Scheme, Buy or Rent Option, and even Mortgage Subsidy (arrow E), all launched before the bubble burst in 1997 (dotted line 5);

d)      It was only after the 70% the collapse in home prices around the SARS bottom that the government hurriedly withdrew as many as five housing interventions (green arrow F)!

New up cycles, new intervention temptations

Since the 2003 lows, the return of a housing upcycle (dotted lines 6+7) yet again lured the authorities to launch several rounds of new measures in an attempt to be seen as ‘doing something about affordability’, these included My Home Purchase and the so called ‘practical but not extravagant’ new variety of HOS  (brown arrows G+H)… go figure the multitude of nuances in all these fancy layers of welfare!

Sadly for the mandarins in charge, the global zero interest rate environment pushed property prices to even loftier heights, to finally reach a triple top in 2019-2022. This unacceptable situation had to be stopped, so in a flurry of new initiatives, we saw Green Form HOS, White Form Secondary Market, followed by LPH/ Private Sales Subsidised Sale Flat Pilot Scheme/TH amongst others (brown arrow I). All this illustrates is how confusing and short-sighted our housing policy has been, with disappointing absence of logical philosophy on housing welfare provision.

Recent months, the increasing intensity and proliferation of initiatives echoes the same panic last saw in the 1997 peak, presaging that another major top may be in place for this cycle (cf arrow E vs arrow I): at the time of writing, prices have fallen by 12% from the September 2021 highs. Your correspondent fears that in another year or two, there may be a repeat of policy U turns saw at the last major bottom (ie green arrow F vs arrow J)…

In order to illustrate the point on this predictable cycle, we plotted the cause of policy actions (i.e. private home prices, see the blue line in Chart 2) against the symptoms as expressed through the political pressure (quantified by say the PRH waiting time, see green line), and then the result being the number of government interventions (red line). There is an eery correlation of the three:

Chart 2: Home prices leads PRH waiting time, which impacts the intensity of government’s meddling in the housing market

The general pattern seems to be that the number of public housing schemes (i.e. the frequency of market interventions) fluctuates with the length of PRH waiting time; and the latter reflects of the swing between greed and fear as property price fluctuates. The blue line in Chart 2, being a lead indicator, suggests that as the decline in property prices continues, average waiting time will also recede, to be followed by the phasing out of various government schemes around 2025-7 (ie red line will turn down too).

What the above chart also suggests is that government policies are always too little too late, what the various recent interventions/initiatives are already 3-4 years too late, and the drop in home prices will mean that these policies are yet again pro-cyclical, ie increasing price/demand volatility rather than solving the root cause of the problem.

Simple is beautiful – learn from Shenzhen?

Hong Kong’s housing welfare policy/administration has long been held hostage by various vested interest groups, leading to endless proliferation of conflicting policies which only complicate and confuse the people. But across the Shenzhen River, our neighbour has a much simpler public housing set up, with only three layers and minimal overlap with the private market. This enables much more focused welfare delivery with less wastage – a real breath of fresh air indeed:

Chart 3: A timeline of Shenzhen’s major public housing schemes changes

Even though housing policies in Shenzhen seem to be driven strong property price moves just like in Hong Kong (see arrows a-c), but changes to old schemes are accompanied by abolition of obsolete schemes that no longer work. This is strong contrast to the dazzling array of overlapping complexities that typify Hong Kong’s set up.

As a further example, Shenzhen plans to supply/allocate 80,000 welfare housing units (c. 4 million square metres in gross floor area) and 60,000 private units (c. 6 million square meters) in 2023. This translates to a public : private unit and floor area ratio of 4:3 and 4:6 respectively; compared with Hong Kong's overkill target ratio of 7:3, Shenzhen appears to have a freer housing market!

Policy back to basics: abolish HOS, reduce PRH

Since 1965, Hong Kong has launched a total of 18 public housing schemes, of which 10 are still in force (Chart 1), but the housing problem has only worsened. Not only has public housing policy been widely criticised for exacerbating housing shortage, but has had the adverse effect of HOS breeding more of the “poor” and the “lazy”; this is detrimental to social mobility, but also wastes vast amounts of social and monetary resources.

In view of this quagmire, the government should radically reform as soon as possible:

a)      to make available all HOS stock to the private market, this will immediately enlarge supply and can rapidly bring property prices back to more affordable levels; and

b)      limit scope of PRH to the most needy, vulnerable group in society (rather than the current 35% of all population!); by releasing land to the private leasing market, even the high rents we see now stand a chance of moderating, thus lessening the pressure on the government to engage in counterproductive market interference.

Chart 4: existing housing benefits a sore sight of complete mess


Chart 5: rationalised housing benefits led by private sector removes need for intervention 

If only the government would allow the invisible hand to allocate supply/demand and prices in housing like so many other commodities are permitted to, then the reason for the existence of such a mess and policy nightmare as shown in Chart 4 vanishes. When returned back to basics, the government’s role will shrink to operating a basic safety net (red area in Chart 5) of physical shelter provision, and perhaps as a transition into the private market, a limited extension into rental vouchers but limited to say 10% of population. This way, even the voucher recipients get freedom of choice in finding the right homes in the right districts, and at the right prices according to the welfare beneficiary. Such an elegant solution will also forever eliminate the endless expansion of bureaucracies, sluggish liquidity/mobility in the housing market, and of course the constant exploitation of an unfair welfare system – a blessing for Hong Kong from every angle one views.

A truly flexible, effective and fair proportion of housing provision by the public sector should be as low as possible, and by no means the 7:3 ratio under current policies (as indicated by the red arrow in Chart 6), by providing low-level safety net physical housing (green arrow) coupled with monetary subsidy for the next poorest group. If Hong Kong continues to imitate badly what Singapore does for its own specific social political reasons, it will only be further left in the dust by a younger, more dynamic neighbour in Shenzhen!

Chart 6: The proportion of public housing is surging again, bad news for future freedom of Hongkongers…

For a revision of some of your correspondent’s past analyses on Hong Kong’s housing welfare, here are the links to recent publications for your reference:

HK’s Ever Ballooning Public Housing Addiction Cycle 11/2021 (Web, Blog, LinkedIn)

as well as some earlier writings in Chinese:

居屋政策 好心做壞事 20147English Google translation (Web, Blog)

公屋改革面面觀租金偏離市場20149English Google translation (Web, Blog)

公屋改革面面觀結構性自我膨脹 20149English Google translation (Web, Blog)

公屋改革面面觀公屋「豪宅化」201410English Google translation (Blog)


The author would like to thank Alice Yurong Zeng from the Chinese University of Hong Kong majoring in International Business and Chinese Enterprise for assisting in data collection, analysis, and drafting this article.


2023年8月1日星期二

商舖業權 是否大戶盡攬?賣地條款 應否散賣為多? 20230801

本文亦於2023年8月1日在【信報】刊登:商舖業權是否大戶盡攬 賣地條款應否散賣為多

出外用膳,如要在女人街/廟街或朗豪坊/MOKO間選擇,閣下會去前兩者或後兩地多?又或須於登龍街/耀華街或希慎廣場/時代廣場間挑揀,結果是否一樣?以上問題所帶出的,正是高度分散但成行成市,與一手包辦精挑細選間的分別,亦是香港零售佈局間接地在政府賣地政策下造成的新現象:零售物業正越趨集中,同時用家(即商號)的選擇卻逐步縮減。

為佐證以上假設,筆者將過去20多年本港零售物業存量作起點,再把七大發展商(下稱「大戶」,包括新鴻基,恆基,長實,信和,新世界,恒隆,太古)之零售樓面面積加之,以計算其比例;得出結果如【圖一】所示。除了2006年整體存量大增扯低比例,及2011年太古沽出太古城中心而略為下挫之外,基本上比例是年年有升歲歲不斷:

圖一:大發展商零售樓面之市場佔比節節上升

七家大戶在香港零售物業樓面面積的份額從2001年的23.8%到增長到2022年的25.8%,而且比例的上升更是伴隨著整體存量的增長(期間存量上升了2650萬呎或27%至1億2590萬呎)同時發生的。 

地皮規模越巨 大戶優勢越大

至於為何大戶能夠越買越多?是否小發展商買少見少?還是發展複雜度令就算是近年勇猛入市的內房生力軍亦望洋興嘆?

只要從賣地的地塊大小來看,可以見到一個長線趨勢:從1990年到2022年,政府所賣出的純商業用途地皮的平均樓面面積不斷趨勢性地增大,由1991年的30萬呎水平倍增至2022年的60萬(【圖二】藍線及藍虛線)。而賣出商業用地的平均樓面面積的最高紀錄亦於2019年創出,達160萬呎:

圖二:零售樓面之平均面積持續膨脹,加上樓價升勢令入場門檻高不可攀?

與此同時,隨著零售物業樓價不斷攀升,發展商所需投入的資金就更升得快(見上圖紅線及紅虛趨勢線),導致小型競爭對手難越雷池。令七大戶能囊括更多的優質地皮,構築其商業王國。另外,就算將紅線以恆指地產指數作調整因子,以顯示整體地價在上市發展商之間的可負擔程度,亦得出同一結論,就是越賣越大塊的地皮規模連小型上市公司亦難以負擔(因經調整後銀碼仍以幾何級數上升:見綠線/綠虛線),只有望地興歎……

出名眾老店 物業多自持

以上所見之大財團壟斷趨勢,似是政府賣地習慣下養成。就算不是官僚政策,卻在不經意中造成小商企無力自置物業之事實。若果賣地條款能規定某部分樓面必須賣散,會否能製造更多專心本業,無須分神跑數交租的名牌、特色商號?假設一個實體鋪面運營需要1,000平方呎的樓面,而以【圖二】中大約每年賣出平均56萬呎的情況下,30年下來,已能幫助起碼17萬名企業家在自己的小天地中專心發展獨特產品,創造長遠財富,就如【圖三】,【圖四】所示,為商界豐富品牌及文化增加底蘊:

       圖三: 百年老店多自置物業                  圖四:其他老店亦非商場得見

來源:https://www.hongkongd.com/hk-shops/

大商場鋪天 連鎖店蓋地

零售場地過度龐大及業權大量集中的後果,除了特色小店難於生存,就是品牌高度集中,及購物體驗千篇一律這一現象。在此筆者嘗試以圖表來量化此一詬病:

現象一:平均商舖樓面面積越大,商場品牌的重複度就越高。【圖五】所示乃是七對商場(皆是本地各商場類別中的頂尖品牌,如地區商場中的沙田新城市廣場,或地標商場類的朗豪坊)中品牌重複度與較細商場平均商舖面積的分佈;顯而易見,面積越大,兩個商場納入相同租戶的比例亦隨之上升:

圖五: 商場品牌重複度與平均商舖面積大小呈線性關連


由另一角度來看(見【圖六】),重複度最高的分別為:

地區商場組別(44%為元朗形點及沙田新城市廣場),可能因為其服務人口較大,而消費模式較同一(比較「民生」),所以得以招攬多為同類的商號進駐;及

名牌商場組別(43%為香港站IFC及九龍站圓方),可能服務的對象都是頂尖奢侈品消費群,所買的亦為大同小異的LV、Gucci之類,所能選擇的租戶實在不多!

而在另一極端,則是重複度極低的與業權分散商場對比組別(僅1%之低,此組包括藍田匯景廣場新城市廣場);前者因為業權早已賣散,兼舖位「劏」到極細(平均大小約為800多呎,比新城市的4770呎相差五倍之多),難怪匯景每多人流如鯽,且充滿市井氛圍:

圖六: 業權分散商場明顯商舖較多,種類亦眾,故此消費經歷絕對不會千篇一律

由此可見,不但由藏富於民、商號自主的社會目的,還是為市民增加消費選擇甚至更廉物品價格去看,似乎政府應該考慮賣地之後商舖賣散的經濟社會效益,而非全由方便規劃、容易管理的官僚角度出發?除此之外,在經濟單一性、財富集中度方面考慮,商舖業權多些拆散更有其政策聲譽效果(如:不是偏幫最富有的一群人玩大富翁遊戲)?


筆者特別鳴謝香港大學房地產及建設系鄧展聰同學協助收集及整理本文相關數據及圖表