顯示包含「英國樓市」標籤的文章。顯示所有文章

2022年10月6日星期四

再論英國樓市 仍見驚濤駭浪 20221006

本文亦於2022年10月6日在【信報】刊登:再論英國樓市 仍見驚濤駭浪

自筆者於5月13日看淡英國樓價以來,基本因素不但不見好轉,更是急轉直下。本文趁更新前篇幾項數據之便,再度呼籲投資者在市況允許之際盡快離場。

當前,影響英國乃至整個歐洲前景的幾個關鍵宏觀因素仍在惡化,但一時的平靜(受惠於夏季溫暖天氣和能源價格暫時調整)隨時會在寒冬降臨時意外地逆轉。以下分析屆時可能發生的情況:

 一)能源緊缺:破壞生計,引發内亂?

當前歐洲所處的窘況可以概括為

1. 因爲政治性的搖旗吶喊,致使歐洲各國在烏克蘭議題上未經思考便全身投入經濟制裁,結果惹來對方報復,令自己陷入能源和食品短缺危機(見【圖一】俄羅斯斷氣過程);\

2. 在不顧有否足夠後備資源的情況下推出類近原教旨主義性質的「綠色」能源政策,加劇能源短缺危機的殺傷力。

圖一:北溪天然氣管道斷氣,歐洲死火?

資料來源:北溪天然氣管道

再看英國現況:在2021年,其四成的電力來自天然氣發電,家庭和企業的能源成本亦因此垂直上升【圖二、三】。如果英國沒有一廂情願地栽入美國好戰鷹派政客的雷雷戰鼓,特別是當自2014年來已經有外交劃船下協議的和約(即法國和德國斡旋而簽訂的明斯克協議),當下能源/食物危機是完全可以避免的。

圖二:英國天然氣價格急升兩倍

圖三:英國能源成本全歐最高(家庭平均能源支出€/kwh)

現今歐洲國家不僅要承受因能源短缺所帶來的工業停產,還要在利率爆炸式抽升的情況下,發行更多國債來救濟國民於能源困境(詳見下文)兼從事一場因不必要的戰爭而要進行的代價高昂之軍備競賽——而在這一蚌鶴相爭形勢下唯一得利的就是外國(如美國)的能源和軍火生產商!在過去三年因封關而摧毀了的中小企產能及中產階級財富已經導致創紀錄的高通脹(見【圖四】),現在戰爭的陰影更會將危機重重的歐洲政經形勢推向完美風暴的中心。

圖四:英國將重演70年代的惡性通脹潮?

二)利率脫韁 央行失控

隨著美聯儲在多年的超低息兼量化寬鬆政策後撥亂反正,積極追加利率至合理水平,其他經濟體亦將步其後塵,拼命追趕:許多新興市場甚至已經步入雙位數利率水平。僅在英國,市場普遍預測,至2023年第三季將再加息250個基點【圖五】;唯筆者擔心如果主權債務危機惡化,利率升幅將會大大高於央行預料。

在新的高息環境下,所有高借貸(即按揭成數)的業主將面臨還貸危機,特別是當其可支配收入已被高通脹蠶食殆盡…

圖五:三大央行利率預計將持續飆升

圖六:回報率跑輸利率——不利樓價

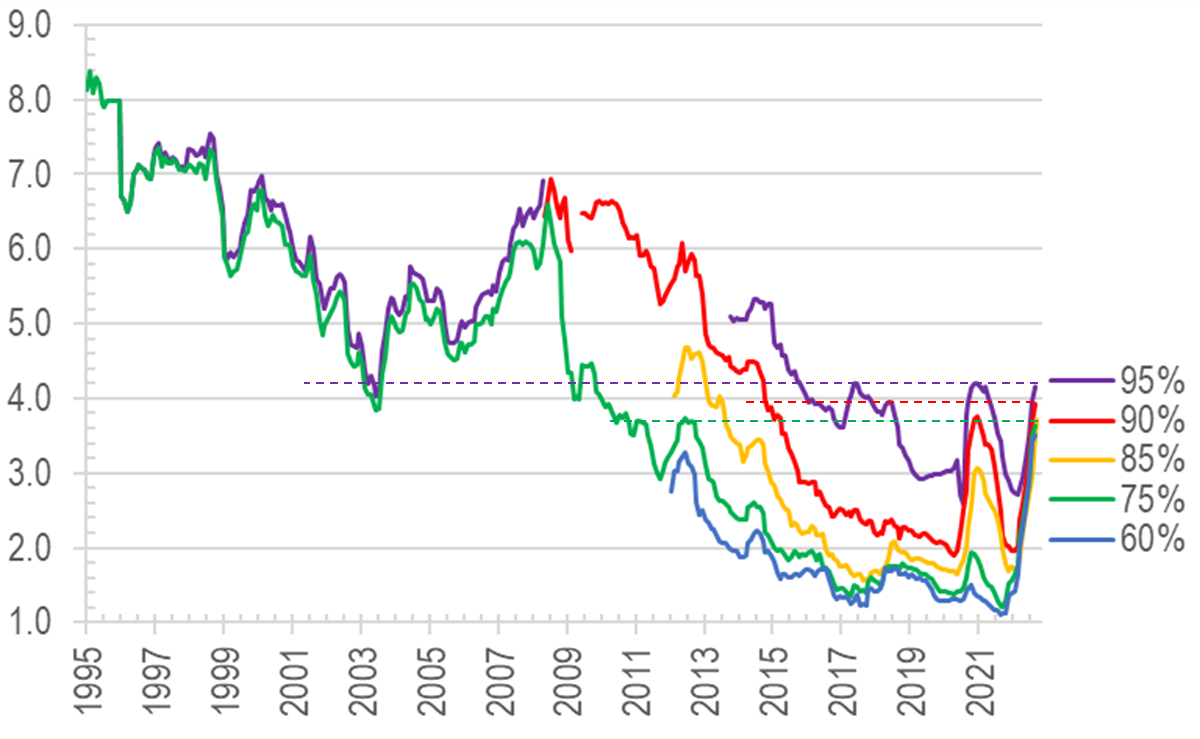
有鑑於此,物業回報率必須跟隨利率上調:除非大幅加租(以【圖六】為例,如果價格保持平穩,租金需勁增60%之多),否則在2025年之前樓價唯有大幅下調。高息率當然不會放過自住業主(儘管彼等不會太計較回報率的高低),因為借貸息率才剛剛起步,向數十年來的新高邁進,如下圖所示:

圖七:以成數分類之英國按揭利率:已升達遠至2002年之新高
三)經濟萎縮難免,騷亂戰爭可期…

鑑於以上極度不利的整體環境,難怪信心指標正急速下滑,預示樓價將在2023年中前下跌(【圖八】);財務總監信心指標亦同步下跌(見【圖九】,驗證筆者5月之預期,並可能持續多數月),可見未來的投資及消費支出展望會極度嚴峻。

圖八:快速下跌的PMI指數暗示樓價有難

圖九:CFO擴張意向:一蹶不振
將以上各項因素歸一於單個圖畫,筆者的「滯脹指標」圖表相當有用;該圖包含家庭收入增長和失業率變化等函數,結果對樓價走勢的影響不言而喻:

圖十:滯脹指標預示實質樓價將在2023-24年下跌

四)對外英鎊越弱,輸入通脹越高

除了總體低迷的宏觀形勢之外,貨幣的劣勢也不容忽視——在錯誤的地緣政治博弈、瘋狂的綠色能源政策、和過度政治正確的意識形態夾擊下,英國的投資吸引力正在急速減少。就算有逃離歐盟的資金,亦可能會繞過英倫而直奔美國。

對海外投資者(包括買英國樓的港人)而言,業主不僅要承擔樓價下跌的風險,還要蒙受英鎊貶值的痛苦。而事實上,英鎊最新的匯率已經跌穿了80年代的長綫支持軌再創新低:

圖十一:在下穿長綫支持軌後,英鎊可於2025年時再跌25%
在插穿此重要技術位後英鎊在未來兩年大有機會跌至0.8美元水平,即再貶值25%。如此慘淡場景令人記起一首聖誕歌的歌詞:
In the bleak mid-winter
Frosty wind made moan;
Earth stood hard as iron,
Water like a stone;
Snow had fallen, snow on snow,
Snow on snow,
In the bleak mid-winter
Long ago.

但願上述情況不會在今年冬天發生……而當政者能懸崖勒馬,扭轉眾多劣政,否則一個慘淡的冬天似乎無可避免。

本文早前出版的英文版本可在此細閱。

筆者特別鳴謝香港大學經濟及金融系陳海嵐同學協助收集及整理本文相關數據及圖表

2021年8月23日星期一

How does property size affect rentals? A study on two London suburbs 20210821


資料圖片,來源:Anthony Delanoix @ Unsplash

It is common knowledge that the bigger the house the higher the price, even though unit prices may actually work in reverse, ie. the smaller the house the higher the per-square-foot price. The phenomenon of higher unit prices for smaller units is likely even more pronounced in densely populated, liquid, and highly commoditised markets like Hong Kong.

In this article, we look at the phenomenon through the eyes of the London housing market. But here, the picture may be more obscured due to a less commoditised (or uniform) housing stock – such as wider variety of land sizes, garden finishes, sun orientations, all factors which could make our size-vs-unit price comparison more difficult.

Landlords can optimise rental income by size bands

We have gathered the asking rent of apartments in a well defined Zone 4 area in London over the past 4-5 years, and the resulting plot shows a very clear relationship between the per square foot (psf) rent and the size of the properties (Chart 1):


(Left) Chart 1: Rent vs flat size: inverse relationship; (Right) Chart 2: Detrended rents to better find correlation between rent and size

This is just the first step in establishing the relationship between our two variables; in order to eliminate the inflationary effect of rental increases over time, we have applied a discount factor derived from average rents over the same period, and by adjusting older data points by this factor, we can establish a ‘detrended rental series’ which more closely reflects the pure size-vs-rent correlation. The result is illustrated in Chart 2 above, where the detrended (or real) rent are plotted in red while the original unadjusted (or nominal) rents remain in blue.

One obvious observation of the red datapoints is that they are more tightly packed vertically, and therefore reflect a more authentic underlying relationship with sizes of the properties. Other interesting points to note include:

  1. the biggest unit rent premium is achieved in the 500-600sf region, dropping from £2.8psf to £2.4psf – a whopping 14% drop (red highlight, Chart 2);
  2. rents then stayed almost flat until just over 950sf when the drop reaccelerates from £2.25psf to £1.6psf around the 1,400sf mark – another 29% drop;

These are very good intelligence/insight for any investors who want to maximise their rental return on investment.

Houses – lower liquidity/transparency than flats

Looking at a nearby neighbourhood where the housing stock is predominantly terrace houses rather than renovated flats, the same rent vs size pattern is also apparent.

However, due to much less emphasis being placed – in the house sector compared to flats sector – on square footage of the premises, there are much fewer listings giving size data for house letting adverts. This may be due to houses tending to offer gardens and other aspects which outweigh purely size considerations for potential tenants. The resulting charted patterns are therefore less representative of the whole sub-sector (hence Charts 3 & 4 showing less dense number of dots).

Interesting observations can nevertheless be made in the house sector – where subdivided lettings (ie <500sf listings – see red highlight, Chart 4) are probably more prevalent, while such segmentation is almost unseen in the flat sector:

(Left) Chart 3: house rent vs size; (Right) Chart 4: Detrended house rent vs size

Whether it be enterprising house owners subdividing or friends sharing bedrooms in one property, the economics are even better for the landlord, as the unit rent for a 300sf offering could go as high as £3.4psf, and this is for a neighbourhood slightly down market from the apartment district we sampled at the start of this article.

In the overall scheme of things, macro political-economic trends, infrastructure build out, and other local micro factors would of course play bigger roles in affecting how much rent can be earned on any property, and that is where much more work has to be done in advance when investing.

Simple rules as applies to property size

There may be other factors that lend to premiums/discounts on properties (eg each 5 mins walk from subway station reduces rent by say 3%), but in our study here, two linear ratios may be derived for easy consumption by landlords/tenants alike:

  1. for the flat district, each 500sf flat may have a rent of £2.8psf, with the unit rate dropping by £0.30psf every 200sf increase in size;
  2. for house district covered above, each 500sf flat may have a rent of £2.9psf with the unit rate dropping by £0.40psf every 200sf increase in size.

In both cases, the non-linear nature of the size-rent relationship makes it difficult for the average retail landlord to set optimal rents, this is why diligence and research are the most useful tools in ensuring the best returns in property – or in layman’s terms: know your market well and stay focused on it.

Chart 5: rules of thumb for the lazy: £0.15 per 100sf for flat market, and £0.35 per 100sf for house market

The author would like to thank Samson Leung of Hong Kong Baptist University for assisting in data collection, analysis, and drafting this article.

2020年9月4日星期五

港人移民利英樓,本文淘金搵寶地!20200904

二O二O年九月四日刊於信報之原文 :


港人移民利英樓,本文淘金搵寶地!

自從七月本港實施新的國家安全法以來,市民有關移民的查詢數字暴增,似乎還有節節上升的趨勢,再度反映港人對回歸後一波又一波政治衝擊下的恐慌【圖一】。與此同時,眾西方國家亦因應國安法的落實,大開方便之門,推出越來越多為港人度身訂造的移民或庇護方案【表一】。

 ________________________________________________________________

圖一:Google搜尋下“移民”頻率因數度政治事件攀升,國安法後更創歷史新高


表一:西方國家宣布之各庇護港人移民方案(更新至8月27日)

 ________________________________________________________________

本文較深入地探討港人因BNO護照移民對英國各區樓市供求上的影響(以英格蘭為主,因其人口數據較蘇格蘭及威爾斯全面),及各地樓價受惠程度上有何不同。


新港人若隨本土華人現行分佈落戶

評估港人如何擇地定居方法眾多,例如以收入階層分佈作估算(可惜BNO護照持有者資產/收入分佈數據欠奉),或者較簡單地以英格蘭當地華人的現成分佈作參考(因當地此類人口數據已齊備)。

以華人分佈來估算港人移民目的地可能產生少許誤差,因為當地華人經歷數十載本地生活,可能已經融入了英國小鎮、甚至鄉郊社區,這會是剛到埗港人所難以適應的。此外,中餐經營者可能會推高當地華人在小鄉鎮的人口比例,但大城市卻可能是港人移居的首選。


無論如何,以下是兩個較為清晰易明的方法去描述華人(多為港人)現在如何在英格蘭各大地區的分佈:

 ________________________________________________________________

圖二:華裔人口佔各地區總人口比例——內倫敦最高


圖三:最大的華裔群組也居於內倫敦


________________________________________________________________

由上述數據可發現不少有趣現象:

一) 只要一成合資格港人移居英格蘭,當地華人數目將從現在的43.3萬大增30萬,即飆升70%之多;

二)  如果所有合資格港人(約300萬)都移居英格蘭,可能增加種族緊張,因為華人的比重將一下子由0.7%彈升到1.2%,如此升幅,實非小數;

三) 假設港人以目前華人分佈的比例移居英格蘭【圖四】(因當前的分佈已反映當地大部分原是港人的生活習性及喜好),各目標城市/郡/地區將承受可大可小的負擔,由住房需求到基礎設施,以至服務需求。以下集中討論房屋方面的情況。

 ______________________________________________________

圖四:華人在英格蘭不同地區的集結比例

  ________________________________________________________________

倫敦,漢普郡,諾定咸面對最大潛在房屋需求?

假設30萬之數的港人成功到埗,現有的空置房屋將會是首先被購買入住的目標。以此來計,漢普郡、倫敦及諾定咸的樓市將面對最嚴重的供不應求局面,即【圖五】中所有y軸值大於1地區:

 ________________________________________________________________

圖五:新BNO移民對房屋需求對現有空缺-倫敦、漢普郡及諾定咸最受壓力


圖六:連帶未來兩年的落成量,倫敦/諾定咸/樸茨茅夫則是受壓力最大的地區


註:圖內數字所代表地區,見【表二】


 ________________________________________________________________

就算計入往後兩年的新供應,市場緊張情況亦難以緩解(假設2020年及2021年能夠維持2019年的落成量)。住房負擔最重的地區依次為倫敦(【圖六】2號點和3號點),約克(4號),樸茨茅夫(14號),諾定咸(7號)。

實際上,若全數合BNO資格的港人移居英格蘭,則內倫敦的供求比會暴漲到6.7倍(見【表二】第六列,相對以上假設10%港人情況下的0.67倍)。在如此一面倒的需求狀況下,熱門地區的樓價似乎將陡增無疑……

下表將前30位「人滿之患」地區之細節舉列之:

 ________________________________________________________________

表二:BNO移居的住屋需求


 ________________________________________________________________

有否其他英國樓價的泄壓閥?

儘管數以百萬計港人從天而降對不少英國地區會造成不可承受的壓力,但這個情景並非沒有消減的對策,例如其他國家政府提出的移民措施【上表一】,甚至如「國際特許城市」類的提議(即專門為港人而設立的地域,定位類似香港本身現在的「特別行政區」,包括自有的稅制和法規)。此一設想和回歸時的「一國兩制」安排似曾相識,只是地點不在華南岸邊的香港,而是在世界其他地方。


筆者特別鳴謝香港城市大學學生潘璟誼協助收集及整理本文相關的數據及圖表