Below is the English translation of an article published in the January 2014 issue of HKEJ Monthly:
Outlook of UK
Property amidst slow growth and tax crackdown
In recent months it
seems, whichever direction one turns, from newspapers to letterboxes and even
email inboxes, overseas property sales advertisement are omnipresent – be it
familiar markets such as UK/US/Australia/Canada, or Singapore/Malaysia, even
depressed Japan, or the sovereign debt troubled Spain/Portugal seem to be
selling properties in Hong Kong.
However, buying property
long distance already increases risks, let alone acquiring real estates located
in places of different languages or unfamiliar commercial/legal cultures. Extra
due diligence is therefore paramount to investment success. The writer tries to
stick to markets which are easier to understand, and the one top of the list
has to be UK. This article tries to look into various fundamental factors in an
attempt to increase readers’ odds should they be looking at overseas property
investing.
Where stands the UK property cycle?
The key advantages of
investing in property are its long cycles, and the lack of market/insider
manipulation like in investing in securities. As a result, one only needs to
invest at turning points of these cycles to generate long term and repeated
above-normal returns. Besides price cycles, another important indicator is
affordability, below we look at the UK market from the point of view of
valuation to determine if it still is a good time to take a plunge in this
market.
Home price to income
seem expensive, but mortgage affordability remain good
If left untouched,
the free market would have allowed prices to rise and fall by the balance of
forces between supply and demand, however, since the global financial crisis
(GFC), all governments around the world seem to have taken on the role of God,
trying all means at their disposal to prop up all sorts of asset markets. The
result is the loss of the price discovery mechanism and a general loss of
information content in whatever prices we see being transacted. In the case of
the UK property market, what should have been a 50% fall in price seemed to
have been arrested by the combination of zero-interest rate policy (ZIRP),
quantitative easing (QE), and fiscal stimulus (such as Help to Buy), resulting
in a rebound in prices after barely a 25% drop.
Currently, average
home prices in the UK are equivalent to 4.67 years of the average full time
worker’s income (Chart 1), and looks set to continue rebounding some 7% in the
coming year, with a chance of breaching the bubble high levels last reached in 1988/9.
This bounce in the national prices are too modest compared to London home
prices, which helped by external demand (of which China/HK money rank amongst
the top sources), safe haven effect (i.e. all European countries hit by tax
hikes and banking crisis, such as France, Greece, Spain), has been rebounding
strongly since back in late 2009, to have risen over 30% against income levels.
London’s price to income multiple now stands at 6.06, and could well reach the
top of the historic range around 2016 (Chart 2).
 |
| Exhibit 1: UK house price to earnings ratio |
 |
| Exhibit 2: Greater London house price to earnings ratio |
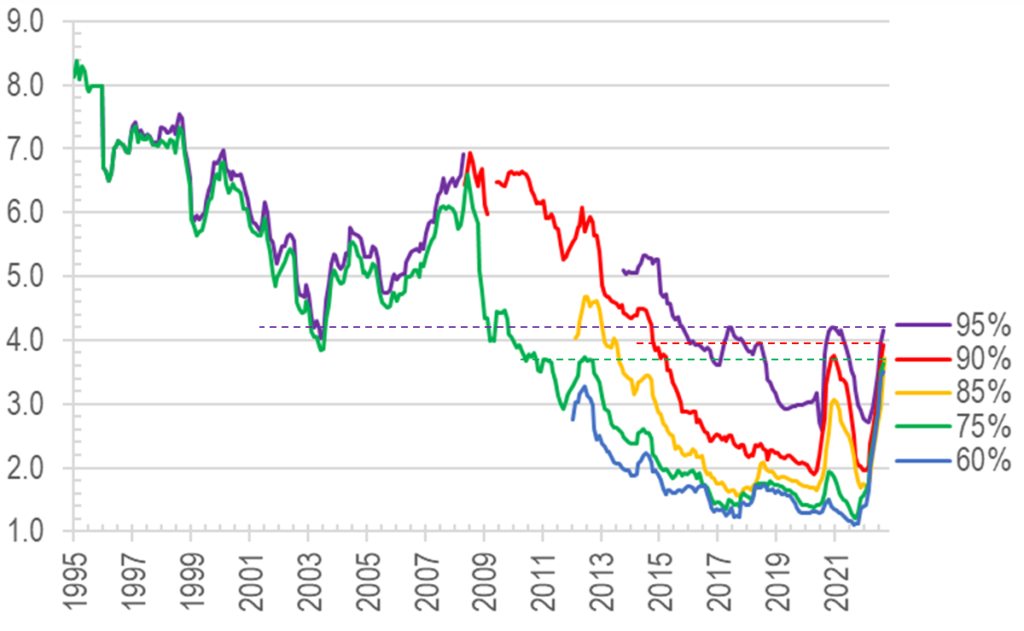
Whilst expensive in
price-income multiple terms, housing valuation needs also to be viewed in the
context of mortgage affordability (i.e. what proportion of monthly income is
used towards mortgage repayments). In this measure, the central bank’s ZIRP has
helped a great deal, and alongside recovering lending appetites amongst banks,
mortgage costs have steadily fallen in the past year, leading to the UK
mortgage affordability measure nearing historically low levels, and at almost
one standard deviation below historic averages (Chart 3).Over in London, the
stronger rises in prices have more than offset the magnitude of falling
interest rates, resulting in the London mortgage affordability measure rising
for two years in a row – even with another 16% rise in prices, the measure only
just returns to the historic average line (Chart 4).
 |
| Exhibit 3: UK mortgage affordability |
 |
| Exhibit 4: Greater London mortgage affordability |
The above two sets of
charts clearly illustrate that, without forceful administrative intervention,
UK home prices had more to fall; however, with interventionism and political populist
very much the mainstream philosophy, adding to that uncertain pace of economic
recovery, government support for the property market will likely remain the
main factor influencing home prices.
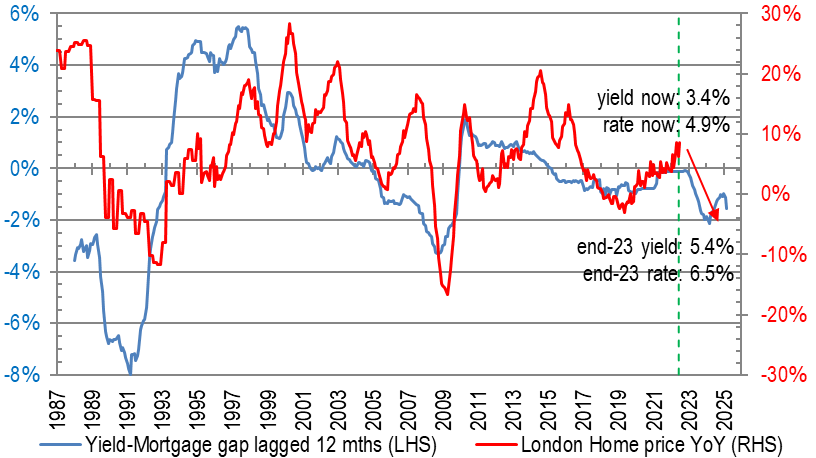
Home prices not
attractive if income and rental yields are factored in the equation
In order to combine
the income and interest sides of the analysis employed above to look at the
whole picture, we can combine the key home price drivers – income, interest
rates, and rental yields – into a ‘composite valuation index’ to reach a result
akin to that shown in Chart 5. Unfortunately, despite recovering income and
suppressed interest rates, rental yields have also fallen, resulting in the
composite valuation index to reach levels similar to the 2007 top already!
 |
| Exhibit 5: Composite house price index: High |
In a still low
interest rate environment where government market support is unlikely to
withdraw, we are afraid that the trend in the next two years will most likely
be higher highs in the composite index, until around 2016 before a correction
will be seen.
Tight supply also
favorable to home prices
Besides
affordability, another key factor driving home prices is supply. In this
regards, the tight credit environment and slow economic growth has led to
falling completions; this combined with household formation remaining at
elevated levels, has pushed up UK occupancy rate back to the range seen in the
90s, or an occupancy rate of 96.6% (Chart 6) – this high occupancy rate will
benefit rents and prices alike. Looking at the planning permission figures of
the past three quarter, completions will likely stay low in the next six
months, at an annual rate of around 150,000, which is significantly lower than
the 200-220,000 levels before the GFC. Overall speaking, in the short term, UK
supply will likely stay below demand.
 |
| Exhibit 6: Supply falls for 2 years, and occupancy rate increases |
 |
| Exhibit 7: Completions for the 3 quarters will be low |
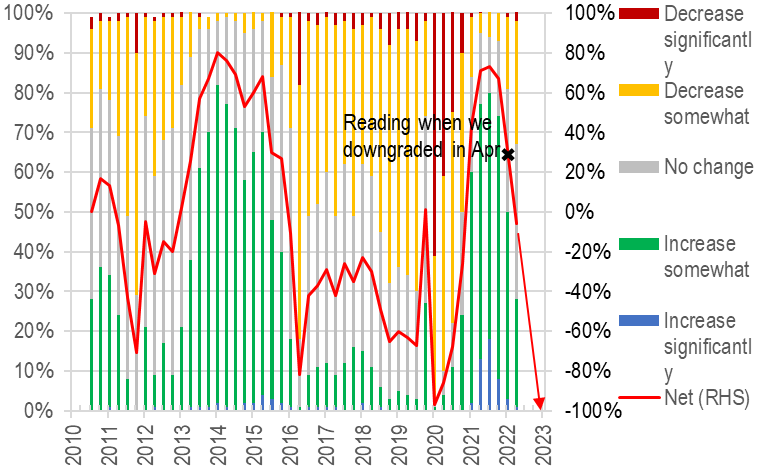
Economic growth – not out of the woods yet
The greatest
challenge to home prices in the future remains low real income growth (Chart 8)
which will restrain rental increases and therefore property prices. Further,
fast paced economic growth seen in the UK since the 80s (i.e. the portion above
the dotted line in the chart) may have coincided with financial sector
deregulation (i.e. Big Bang) and the peaking global interest rates in 1980.
Both these factors are now in reversal, with no prospects of improvements to
help the economy outperform.
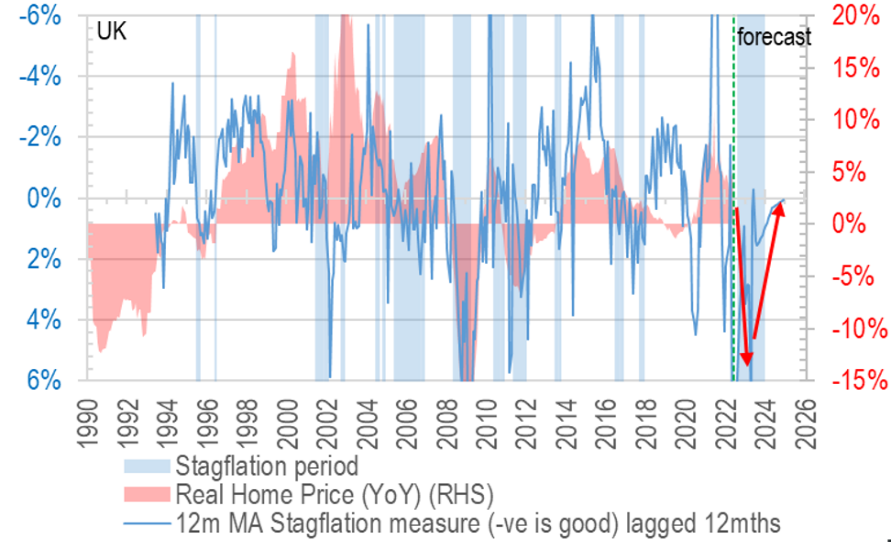
Whilst in the short
term, low interest rates will continue to provide support, this remains an
artificial ‘life support’ mechanism which will one day be taken away, adding to
that the spectre of a Euro sovereign debt crisis, risks remain that home prices
could mean revert towards income (Chart 9).
 |
| Exhibit 8: UK average real disposable income: no longer as strong as before |
 |
| Exhibit 9: House price growth is higher than the growth of the economy and earnings |
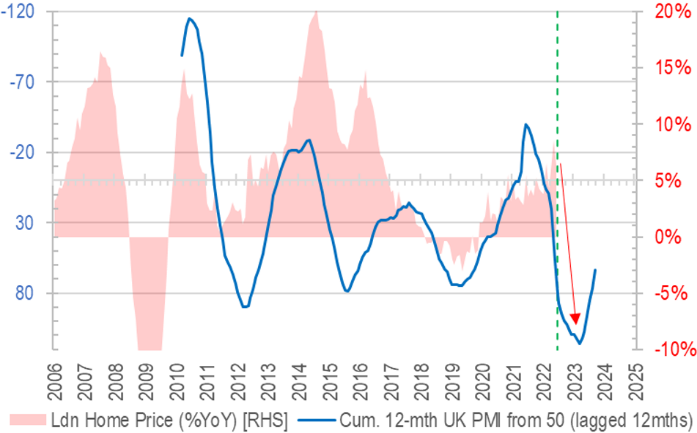
Besides troubles in
Europe, it seems that the global economic growth engine that is the USA may
weaken – after over three years of recovery, the initial jobless claims numbers
may have reached a multi-decade low (red arrow in Chart 10). Whenever the initial
claims numbers start to enter a rising cycle, stock market indices stagnate or
even worse, enter bear markets. So, with the economies of two of UK’s most
important trade partners entering a period of high uncertainty, risks also rise
for UK’s economy and property market. The question remains of whether:
governments allow markets to falter (arrow B in chart) or another round of QE
saves the day (arrow A in chart)?
 |
| Exhibit 10: US job market recovery may be about to end |
Fiscal difficulties + popularism = higher taxes have
only begun
Another important
factor that investors in UK properties need to increasingly take heed of is the
implication of structural budget deficits (Chart 11) brought about by high
welfare. When government debts are at the highest levels since the 60s (Chart
12), and when interest rates cannot fall further to reduce the debt financing
costs, higher taxes may be the only way forward.
 |
| Exhibit 11: UK government has been in budget deficit since 1960s except for fiscal year 2000/2001 |
 |
| Exhibit 12: UK net debt will not decrease until 2015/2016 according to Treasury's optimistic prediction |
Which sector is most attractive?As is common in many
jurisdictions, the need to appease domestic voters will continue to increase as
prices rise further, shutting out local potential home buyers. As a result,
punitive taxes aimed at overseas owners/buyers (such as the Mansion Tax) will
become more severe and more widespread – investors should be prepared for this trend
unfolding in the next two years as elections loom.
By this stage, we
hope to have highlighted the main pros and cons in investing in UK property. If
you have already decided to put money into this market, you will certainly have
heard all about buying location and quality (rather than cheap prices).
However, it appears that quality and premium products are now reaching levels
where the benefit no longer justify the cost – for example, West End prices
have already outperformed Greater London by over 30%, and an even more
substantial 100%+ when compared to national average prices (Chart 13).
With the rush of
overseas buyers pushing prices to unreasonable levels, combined with the
government targeting luxury homes (eg those over 2 million pounds), property
prices in the more expensive districts have already started sliding, and looks
set to continue in this trend to at least the middle of 2014 (Chart 14), if not
as far as 2015/6.
 |
| Exhibit 13: West end house price increases faster than London and England & Wales |
 |
| Exhibit 14: West end/London price ratio is high |
Given this possible
outcome, what you see in your letterboxes (most likely in the most expensive
parts of London) will probably not be an outperforming asset in the near
future. For good value sectors, office property outside of London may have
better upside (Chart 15).
 |
| Exhibit 15: UK office price (excluding London) is still cheap |
The author wishes to thank Mr Simon Zhu’s help in
assisting in the collection and analysis of information used in this article.