顯示包含「GDP」標籤的文章。顯示所有文章

2024年5月29日星期三

Is the big rush into Japanese property justified? 20240529

We have heard nothing other than 'we are buying Niseko ski flat' or 'our fund is adding Tokyo hotel' for the past few months, as if the rest of the world is all in the dog house...

Clients familiar with our arguments will know we have been negative for at least 2 years on the Japanese market, so this email seeks to give a more rounded exposition on why.

When crowds scramble one way, we go the other

The recent scramble for adding Japanese exposure (see Article 1) is in line with the concurrent rise in the Topix, but in property land there is even more momentum, especially amongst funds:


Granted, funds have been sitting on their hands in the past 2 years as interest rates globally spiked, and their IRR calculations were thrown into disarray. So the wishful hope that Fed rate cuts will be implemented (now proven wrong), plus a reversal of Japanese asset depreciation has sparked a sudden fad into pumping money into the land of the rising (may be now setting) sun...

We are very wary of the much more significant risk of Yen devaluation against whatever puny asset appreciation in the currency in the coming years however, and would prefer other jurisdictions where BOTH currency and asset prices will rise (regular readers will know where that is!).


FX should be central in investment decisions

The point of making price gains but adding translation losses is best illustrated with a view to history:


As shown above, during the haydays of Japanese industrial and cultural ascent, both asset prices in local currency (LC) and exchange rates were on the rise - see left green arrow. The combined effect for foreign investors is even stronger returns in USD terms (red line) than locals (blue line), shown by the purple enlarging triangle.

In the subsequent lost 2 decades, Yen basically went sideways (2nd green arrow), with price drops very comparable in LC and USD (purple parallelogram).

We are now probably into the next leg of Yen derating (see 3rd green arrow) thanks to shrinking population - see Article 3 - and the resurgent commodities complex when all input materials see price spirals. Unsurprisingly, since 2010, despite LC price gains, USD denominated values fell (purple trapezium).

We expect the next (final) down leg in Yen (4th green arrow) to unfold in the next 3 years or so, which can also destroy value for overseas investors (ie down red arrow despite up blue arrow).

To put it in numbers terms, below is a table showing the impact of Yen weakness (red shades) vs USD denominated Tokyo home prices:

Of course, the 2025-29 projections above are purely based on the arrows in chart above and may not play out the way we projected, but the risk that you get negative USD returns (2nd column from right) is very real indeed.


Macro picture for Japan: far from rosy

By the combined will to reintroduce inflation and to inflate away the mountains of govt debt (highest in OECD), the Japanese work force has been earning negative real income for the past two years:

In the meantime, the cost of living crisis left private consumption down for 4 quarters in a row, with little help to exports (net exports were increasingly negative in recent quarters) to contribute to GDP growth:


In the meantime, the geopolitical tensions between China and US is causing the rate environment to surge further, due to:

1) loss of demand for US debts by big traditional owners like China (fr 8.9% to 2.2% in 13 yrs) and HK, in fact Japan has also been falling in total proportion of US treasury holdings (fr 9.5% to 3.4% now):


2) Ukraine/Middle East conflicts likely to trigger more input price inflation, eg oil prices - and as a resource poor but manufacturing intensive economy, higher oil prices (blue line, down is higher prices) will tend to trigger economic contractions (red area). The green line is merely projecting prices returning to $150/barrel, which can easily be exceeded should international wars flare up again:


The result would be grim for Japanese economy. If wars spread to the APAC region, there is an added strong chance of capital flight from Japan given its recent militarisation movements might scare foreign investors away:


3) bond rout will impact Japan more than US - as US fiscal profligacy continues (yes, by adding $3.5tr debt in one year), long bond yields have nowhere to go but up (orange line), this will drag JGBs up with it (green line). Assuming totally benign geopolitical/sovereign debt calm conditions, the laughable 0.87% JGB yield will still nearly triple to 2.5%, and this 'benign' expansion of US-JP yield spread may trigger further capital outflows as money seeks higher returns in the US:


The result? Yen could drop another 25% to the 200 mark.

If this Yen drop becomes disorderly, it could result in JGBs trading at premium to TBs, leading to the much more nightmarish outcome of 10.5% JGBs vs say 8.5% TBs:


Such an outcome would mean Yen has to return to 270+ levels, much against the wishful sub-150 levels the 'anchoring biased' talking heads out there could imagine... or a 45%+ drop from current levels.


Real yields also too low to be attractive

Back to our usual real property yield table - Sydney/Singapore/Tokyo are some of the lowest returning markets on inflation adjusted basis (3rd column from right), compared to Phnom Penh/Athens which are our preferred investment destinations:


In a bond rout outcome, both European and Japanese markets will suddenly look much worse as US becomes the safe haven, thereby helping HK/NYC (2nd column from right).

Based on these various factors, we will only touch Japan if: a) long term fixed rate borrowing can be locked in; b) Yen leverage and/or hedge are put in place. But how many even the big institutions are taking these precautionary measures? We doubt many. On this note it is interesting to demonstrate how institutions are mere humans, however smart they otherwise appear: see Article 2.


==================Article 1==================

Interest in Japanese real estate grows despite rate rise prospects

Mar 8, 2024

Institutions and family offices are backing real estate for another strong year, despite the prospect of the country’s first interest rate rise since 2007.

​https://www.asianinvestor.net/article/interest-in-japanese-real-estate-grows-despite-rate-rise-prospects/494795​


==================Article 2==================

Hidden billions in Tokyo real estate lure activist hedge funds

Apr 16, 2024

The long-concealed market value of Tokyo’s largest skyscrapers is being unveiled by activist investors.

​https://www.japantimes.co.jp/business/2024/04/16/companies/headge-funds-urge-japan-real-estate-sales/​

==================Article 3==================

Japan’s Population Declines Again: Seniors 75 and Over Top 20 Million for First Time

Apr 24, 2024

An estimate published by Japan’s Ministry of Internal Affairs and Communications shows that the total population as of October 1, 2023, was 124,352,000. This was a drop of 595,000 (0.48%) from the previous year. It is the thirteenth consecutive year that the population decreased. The population of Japanese citizens was 121,193,000, for a record year-on-year decrease of 837,000, or 0.69%.

​https://www.nippon.com/en/japan-data/h01967/

2023年11月28日星期二

HK Petrol Supply should be treated the same as Electricity/Gas 20231128

There is one thing that Hong Kong reigns supreme on global league tables – besides its high academic IB scores or long life expectancy – the city is the world’s most expensive place to buy petrol:

Figure 1: not the right reason to be named world #1?

So just how expensive is the cost of petrol to the citizens living here, and is there something that should be done about this exorbitant cost? Below we delve into the wonderful world of high land costs, oligopolies, and misdirected net zero policies to unravel this unfair set up that is likely hampering business and living costs for all Hongkongers.


Disadvantaging business vs competitors

Naturally when comparing competitiveness with other jurisdictions, we turn to fellow small open economies such as Singapore and Switzerland, while also benchmarking two larger countries for added context. In this exercise we have chosen Japan (for Asia comparison) and USA (for global context):

Chart 1: absolute petrol prices – HK is head and shoulders above rest of world…

Chart 2: we pay almost 3x as much as the average US driver

According to Bloomberg/globalpetrolprices.com data, it is eyewatering how expensive Hong Kong’s petrol cost (U$3.09/litre in Oct 23) is compared to Singapore which comes in at U$2/litre, while Japan sits almost 40% lower than Singapore still at $1.21/litre. But US really rules the roost, where costs are another 12% lower at only U$1.07/litre (Chart 1). To put everything in the context of relative premium to US prices, Singapore is already at a high 92% premium, but Hong Kong for reasons we will look into below, doubles that, coming at a whopping 189% premium (Chart 2) – what is disconcerting is how the HK premium has been very steadily ranging from 150-200% since much of the past 10 years!


Petrol overpriced against premium office rent AND per capita GDP

Is this expensive fuel cost a function of Hong Kong’s high productivity or expensive land costs? Sadly not. When plotted against Grade A office rents of various top financial centres, HK really stands out in how costly its petrol is – to return to the regression norm, the price of petrol needs to plunge some 25% as a minimum:

Chart 3: HK’s high petrol costs not justified even factoring in its expensive office rents (as a cost proxy for businesses)

Maybe Hong Kong’s expensive real estate is a reflection of its underlying economic productivity? So we plotted the petrol costs against per capita GDP also – here the trend shows much tighter clustering around the regression line:

Chart 4: petrol costs unjustifiably high in context of our economic output

Except Hong Kong that is… Being a true outlier, our petrol prices needs to be cut an even bigger magnitude of 45% to be near the global trend line!


A double whammy of govt & big oil plundering?

To properly analyse the phenomenon of high prices, we first look at whether Hong Kong is buying more expensive international oils:

Chart 5: Import price seems to be relatively stable compared to average Brent price (and rightfully so)

It seems the spread of imported petrol over Brent price has been quite stable even though the premium does vary from teens to high 30%s in the period we looked at above. As a result, Brent oil price can be a useful approximation to the cost of gasoline for imports into Hong Kong (in the absence of dedicated granular data series thereon).

Breaking out the retail prices into its key components, we can see once more how much the consumer is being disadvantaged compared to other countries – whilst the American driver pays only 42% of hiss pump cost to the oil company and government (the rest being cost of the underlying oil), Hong Kong drivers fork out 81% in the pump price to government and oil company (Chart 7), a truly exorbitant magnitude indeed:

Chart 6: Breakdown of pump price – HK is shockingly high on tax and fees

Chart 7: The same components in % terms – HK consumers pay dearly above underlying costs

Here HK in absolute terms are even more jaw dropping – but what surprises us most is how large the profit element is that the oil company makes, after the government already takes the biggest tax chunk out of all comparable markets already (Chart 6).

But has it always been like this, or is it something that happened recently? Looking at the past 18 years, the government levy has not moved (despite being one of the highest in the world all that time!), but it is the major spike in oil company profits that has hiked costs to the consumer:

Chart 8: Pump price – the biggest rise were in oil company margins over the past 2 decades

If we indexed the oil company margins against HK property prices it actually came in lower than home prices in the same comparison period, but something funny happened in 2018-9 period to the cost of petrol station land costs (blue line), which rose much much more (perhaps due to a combination of new entrants and the government suspension of new station tenders):

Chart 9: Comparing price of petrol filling stations; margins, and home prices

But in any case, the significant surge in recent years in oil company margins (now well above inflation index) bodes ill for consumer affordability.

Not only was the arbitrary cessation of petrol station roll out harmful to competition, as the number of cars will not stop rising as the economy and population grows in the longer term, the wishful thinking that everything can go from carbon based fuel to electric from now on (which was the basis of ending new petrol station tendering) is both unrealistic and counter-productive:

Chart 10: how likely can HK go from 85% carbon fuel to zero in 20 years? 

The outright plunge by global bureaucrats towards their utopian of zero carbon targets by 2030s will create endless suffering to the people over whom they govern – a glance at the blue areas above shows how overwhelmingly dominant the global economy and people’s livelihoods are powered today by carbon sourced energy.

To impose a planned economy style hard target over the citizenry and deprive them of essential energy (red arrow) will surely return civilisation back to the stone ages – in other words, the impossibility to come up with a substitute energy capacity in such a short span of time (represented by the vertical orange arrow) means the global population, if all following this mad course of action, will be deprived of 85% of their current energy needs…

In view of the above, the HK govt should rapidly reverse its policy and start issuing new petrol station sites without delay – or consumers will continue to suffer.


A new model for petrol station licencing?

Back to the question of affordable fuel for the end user – the traditional way the HK government tenders out station sites has been on a land sale mentality – that is, with a view to selling the site areas to fetch the highest land revenue for the government and not with a purpose of creating a sustainable after market for the masses.

However, if we view petrol as an essential part of people’s daily needs, much like telephone and electricity then why should we not tender petrol stations on a different formula? Whereas the telephone exchanges and electric substations are pretty much given away for free, we submit that petrol stations should also be tendered out based on minimising future fuel costs.

The objective of controlling electricity costs is achieved by the Scheme of Control framework, which is based on return on capital invested. What we should do on petrol stations perhaps, is to have the oil companies bid for each station where the winner of the site is the one that promises the lowest price margins over the prevailing oil price at the time? Not only is this simple formula easy to monitor from an ongoing basis, it introduces a mechanism to drive down long term fuel costs and every economic sector of the society will benefit, rather than just the government’s one off land sale income. Which would you rather trust to keep the spoils from reduced oil company profits – the government or the people? The answer should be beyond dispute…


The author would like to thank Chan Hei Lui Kiandra from The University of Science and Technology majoring in Quantitative Finance for assisting in data collection and analysis of this article.

2023年7月5日星期三

How can HK alleviate the shortage in domestic helpers? 20230705

Any working couple with kids at home could recall the times when the Philippines flight bans during covid lockdowns caused a sudden shortage in helpers and pushed pay upwards of HK$8k a month for a brief period of time. In response to that symptom, the HKSAR government proposed amendments to the “Code of Practice for Employment Agencies” to reduce the ease of “job hopping” among foreign domestic helpers (FDHs).

We do not believe this rule change is the right solution (eg it infringes on freedom of labour, a fundamental human right), but take this opportunity to look at the FDH phenomenon in the context of HK’s economic set up, as well as the specific circumstances of the supply countries, hopefully identifying solutions to the shortage of staffing being reported.

Rising importance in past 30 years

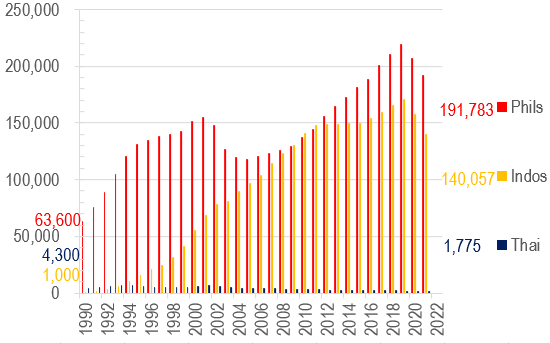
HK’s economy has increasingly relied on the importation of FDH labour presumably as more and more women entered the job market, resulting in the number of FDH rising from 4.5% of total household number in 1990 to 12.7% in 2021 (blue line in Chart 1) – a 1.8x increase in proportional terms. However, obviously more singleton families are also employing FDHs (be it elderlies by themselves or unattached young professionals), this explains why FDHs as a proportion of population has increased even more over the same period from 1.2% to 4.6% now (or a 2.8x increase):

Chart 1: Number of Foreign Domestic Helper as a percentage of Hong Kong Households

Chart 2: Number of Foreign Domestic Helpers in Hong Kong

However, this relentless increase in FDH hiring also suffered two bouts of setbacks – one after the dotcom bubble in 2001, and then another drop took place in 2020 (after the protest movement), these are marked by the dotted lines in Chart 1 above.

Within the overall trend of generally rising army of helpers, there are interesting undercurrents too – for example, against the drops in Philippines FDH in 2001-4, Indonesian reinforcements were surging that helped soften the blow. This was until the protests and lockdowns of 2019-20 drove a wholesale drop in all helper populations (Chart 2).

Cheap FDH labour helped HK’s economic wellbeing

In the 1990s when the number of FDHs surged, their impact on HK’s economy, as measured by their pay as a proportion of Hong Kong GDP, was significant – doubling from 0.4% to 0.8% overall:

Chart 3: Foreign Domestic Helper salary as a percentage of HK GDP

However, their input took a dive in the 5 years that followed 2002, dropping by 23% from the prior peak. Today the top 3 helper communities together make up only 0.645% of local GDP (Chart 3).

Changing national compositions driven by economies back home

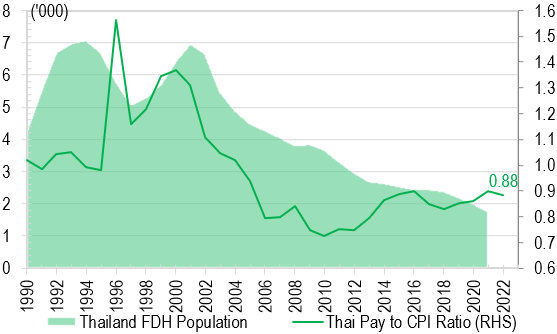
So how has HK’s attractiveness fared in the eyes of the top 3 supply countries? One thing is clear – Thai FDH supply has gone on a one way decline for pretty much the whole of the last 20 years (Chart 6) reflecting HK minimum pay underperforming Thai inflation massively since 2000. On the other hand, Phils FDH numbers have by and large increased, except during 2000-2003 when HK pay fell most against Phils inflation; and only recovered meaningfully after GFC once the pay decline has reversed once more (red line in Chart 4):

Chart 4: Philippine FDH pay relative and population of Phils in HK

Chart 5: Indonesia FDH pay relative and population of Indos in HK

Chart 6: Thai FDH pay relative and population to Thai in HK

Indo was quite different from both Thai and Phils in that despite massive pay underperformance, the absolute number of FDHs continued surging, suggesting that our minimum wage must have been rich income for the locals such that drops vs local inflation has not dented the enthusiasm with which the locals wanted to earn more income in HK (see yellow line in Chart 5).

In the above charts, the ‘pay relative’ measures were arrived at using HK minimum FDH wages, translated into the local currencies back home, and divided into the local CPI, so the lines are a fair measure of how well the FDHs on minimum wages paid in HK compared to their compatriots back home. Put another way, the minimum income vs local CPI can also be expressed in separate lines, as shown here:

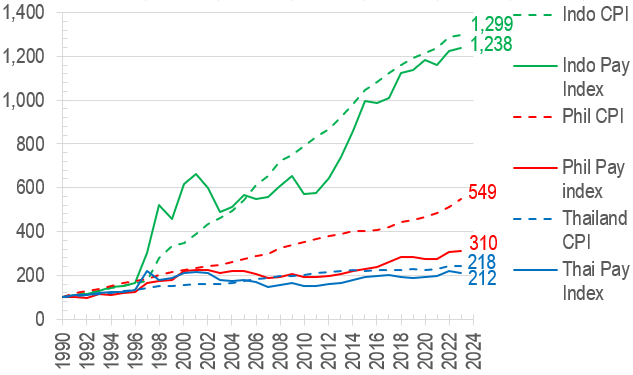
Chart 7: Indo/Thai pays were roughly in line with local inflation, but Phils pay significantly lost out to inflation


The above chart is also telling in that much higher Indonesian inflation over the period compared to Phils (lower by 60%) and even more vs Thai (lower by 83%) may have contributed to persistently higher FDH inflows into HK where price stability is a more important factor and USD based income considered a premium.

HKers have had it good, less so their helpers

Even so, the FDH minimum wage has still lagged behind the minimum wage levels applied to local Hongkongers (see green line in Chart 8), let alone local CPI index. In fact, from the employer’s point of view, their helpers’ wage bills have only gone up 58% over the past 33 years compared to HK inflation rising some 139% over the same period:

Chart 8: FDH minimum wage lagged the equivalent standards for locals, and both lost out to inflation in turn

The above, of course are purely based on the minimum wage measure, when there are a plethora of other administrative costs that is burdening employers on top (flight tickets, insurances, agency fees and other admin costs) which seem to proliferate constantly – perhaps on top of more equitable pay adjustments for the helpers, reform should also focus on how these new forms of administrative burden can be lessened for the hiring families?


The author would like to thank Yip Kin Long Tommy from City University of Hong Kong majoring in Accounting for assisting in data collection, analysis, and drafting this article.


2021年5月12日星期三

HK economics - recovery distorted by base effect

Good 2021 growth figures, but...

After the atrocious contractions of 2020 thanks to lockdowns, recent forecasts on 2021 GDP have turned distinctly rosy, ranging from 3.3% to 4.2% and averaging 3.8% growth. 

However, given the traumatic falls of 2020, these growth figures may still not be enough to take us back to pre-lockdown levels, and the chart below demonstrates this disconnect due to base effect:

Chart 1 : YoY economic growth forecasts mask low base in 2020


The year-on-year growth in GDP (blue line above, extended by forecasts of 2021 represented by yellow line) may appear strong, but if we were to compare this year's performance to pre-lockdown levels, as represented by 2-year changes (red line) , normalcy will not return until Q1 22. The positive blip in the red line in Q3 21 is the result of a bad comparable Q3 19 when the street protests disrupted economic activities.

In fact, the current recession looks much more like the post-dot-com/SARS one in 2001-3 than the GFC episode in 2009-10, as the latter bounced back much faster. Given the shape of the current recovery, 2021 will remain below 2019 levels for sure, and probably 2022 as well.

Return to 2018 unlikely until 2023 at the earliest

So when is the most likely time we will see the economy return to pre-lockdown days? Perhaps not widely known, HK's economy actually peaked in 2018, and has been on a downtrend in 2019 (protests) and 2020 (lockdowns), this year's recovery is yet uncertain, as it depends on how quickly the govt reopens the economy to normal business.

Even assuming immediate opening, which most market forecasts probably factored in already, we are unlikely to see the economic level return to 2018 peak levels until 2023, as the arrows in the chart below suggest:

Chart 2 - Indexed GDPs suggest return to 2018 peak after 2022

If lockdowns are extended, or global travel opening were delayed, the 2023 recapturing of prior high becomes even less probable. As a reference to the last big recession - the 2000 peak was only recaptured in 2004; we reckon the 2018 peak will most likely be retaken in 2023 at the earliest, if the side effects of lockdowns/money printing/supply chain destruction do not stoke second order economic problems or worse political unrests before we get there.