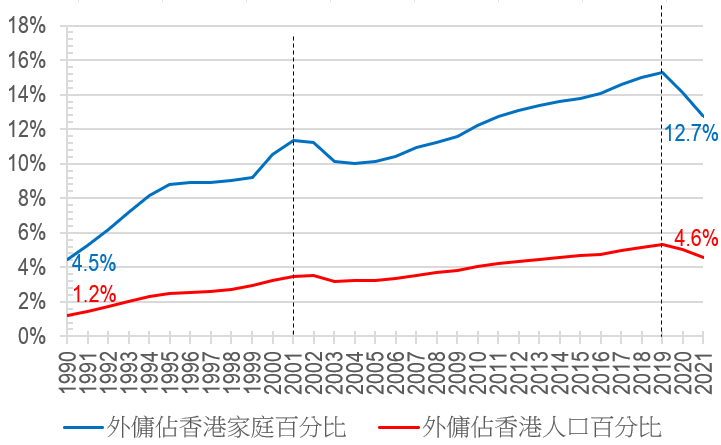
In view of recent reports of HK fiscal deficits, the pundits are yet again out in force, staging the tired chorus (including the organisation never engaged in any profitable enterprise, the IMF) of how HK’s tax take is too volatile and we should reform to ‘broaden the tax base’ and so on and so forth, to the point that even the HKSAR govt has been hypnotised into starting its own initiative looking into this most unsuitable direction to take for an open economy which survives on being a ‘super connector’ (this is the HKSAR’s own term!) of people, goods, capital, and ideas:
Figure 1: resist the temptation Chief Executive Lee, stay narrow and stay competitive

To illustrate the point more explicitly, we have compiled the total number of levies in the key subcategories of taxation for a number of jurisdictions (HK vs Singapore and Switzerland as small open regions, and Australia and UK as traditional OECD large economies). What is clear from the exercise is that the fewer taxes levied in an economy, the higher the economic growth, and vice versa:

We further collected all the government revenue information of the same jurisdictions and put them in the same general groupings but shown in proportion of total revenues.
It is worth quickly explaining what the tax groupings are:
a) direct taxation on people’s economic activities – ie tax on income, profits & capital gains;
b) indirect taxes, in the following activity groupings:
- taxes levied on labour market activities (eg payroll taxes, royalties);
- taxes on property transactions (mostly stamp duty and rates);
- taxes on consumption (ie GST, VAT, plus vehicle and insurance taxes);
- traditional social engineering levies (the so called sin taxes on gambling, alcohol, tobacco);
- new social engineering levies (all the woke and communistic charges that became so popular in recent years, such as climate change tax, carbon credits); and
- border related tariffs/duties (besides traditional tariffs we also include airport taxes – essentially a charge on foreign people crossing borders).
We argue below how careful design
of tax regimes can serve as important factors in promoting the competitiveness
and economic vibrancy of an economy, and how the proportions need to be
adjusted as policy priorities that all governments should pay attention to.
Open free economies tax less on income
What
jumps out from the charts below are that Hong Kong and Singapore rely on significant
land sale revenues (dark red in Charts 1 and 2) as their
fiscal income, which helps when both are amongst the most expensive property
markets in the world!
Further,
HK’s simple and low tax regime as an advantage is also clear – 4 of the
tax categories had nil, or near zero incomes, making it low friction for
commerce, and less cumbersome administration of the same taxes as would be the
case in other countries. Singapore is less simple but still has one near-zero
intake category (thankfully the ‘new social engineering’ group).
Finally,
both city economies have much lower direct tax takes – with HK at 49%
and Singapore an even lower 42% (dark blue area) – thus rewarding work
and enterprise more than their bigger competitors:
Chart 1: HK govt income – low on direct taxation


In the other extreme, UK’s takes more out of income (66% of tax revenue is from income/profit taxes) than all the jurisdictions in our study; of what is left in the tax payer’s pocket, the UK takes a larger slice through consumption taxes (19.8% of tax take vs Australia’s 11.1%, light green in Chart 4) than the other countries. Besides higher tax on income and consumption, the UK also has the most number of headings under which it taxes its people, making it even more unpalatable for the average wage earning tax payer:
Chart 3: Percentage of Tax Revenue Breakdown in Australia

Chart 4: Percentage of Tax Revenue Breakdown in UK

Can HK cancel income/profit tax and levy
sales tax instead?
The
USA did not have income tax until the 16th Amendment was passed in
1913, before that Article 1, Section 9, Clause 4 of the US constitution forbade
direct taxation explicitly. The fact that this provision was inserted in
Article 1 of the constitution is significant evidence that the founding fathers
did not intend the state to infringe on the freedom of the people to generate
and keep their own wealth.
HK’s
situation is perhaps also conducive to a move away from income taxes – by
virtual of its vast trade and re-export flows, immense tariff or sales tax
intake could be achieved without burdening either its wage earning population,
or profit making enterprises.
The
other advantage of a move from income tax to sales tax is the more stable
income stream compared to volatile sources such as land sales and even
income/profits taxes.
Theoretically speaking, private consumption expenditure, when taxed at a mere 10% tax rate on 80% of total consumption can already generate HK$188billion of revenue (Table 2):
Table 2: Theoretical sales tax collectable
for various tax rate scenarios

Table 3: Sales tax at 14% on 80% of consumption more than covers all income tax and corporation tax takes

In other words, Hong Kong can collect enough sales tax with a rate of 13.5% on 80% of private consumption expenditure to cover all the income and corporation taxes foregone if we were to make such a transition tomorrow.
Revisiting
study: less income tax leak = more economic growth
In
our earlier research looking at tax composition amongst US states, it was clear
that more sales tax than income tax allows people keep more of their wealth,
and is better for ecnomic growth, and similarly giving individuals equal or
better treatment than company also engenders prosperity (the study can be seen
here – English: web,
blog,
linkedin,
facebook;
Chinese: web,
blog,
linkedin,
facebook).
Adopting the same analysis in the prior study, we now add our five candidate tax regimes to the study, by plotting them on the same two measurements:
1. sales tax less income tax (x axis) – higher value means consumption rather than savings are being taxed, thus encouraging investment for longer term;
2. income tax less corporation tax (y axix) – a low reading indicates either there is a booming corporate sector or individuals get to keep more of their salaries.
Below chart shows that with current tax compositions, HK and Singapore (near the red states) are better positioned than Switzerland/Australia/UK which are situated in the more oppressive quadrant (amongst the purple states) of the original distribution:
Chart 5: lower income tax for HK/SGP suggests better economic prospects

Then if we replace all HK income/corporation taxes with sales taxes as outlined above, HK’s position improves massively – becoming the jurisdiction furthest right in the study universe (right hand red diamond, Chart 6) and leaving Singapore well and truly in the dust:
Chart 6: by replacing income/corporation tax with sales tax, HK beats all US states on tax attractiveness
The
above scenario places Hong Kong very much near (if not at) the top of the
(Sales Tax – Income Tax) axis amongst the 130+ countries in the world
collecting sales taxes. By abolishing the income and corporation taxes, Hong
Kong’s global competitiveness and attractiveness for almost all global
companies and high income talents, not to mention vast amounts of tax refugees
in developed countries where simply being rich is a sin, and having income
anywhere outside the country’s borders is a reason to be taxed.
Given
the significant benefit of not just economic attractiveness, but also a massive
reduction in administrative burdens that the whole tax collection bureaucracy
brings with the income/corporation tax regimes, improvements in citizen’s
privacy standards (no need to declare what, how, and when you earn your
incomes), Hong Kong can truly become a beacon of freedom and commerce. Chief
Executive Lee and Financial Secretary Chan should ignore the cacophony of calls
from vested interest groups calling for ‘boradening tax base’ including
accountants, regulators, and academics, whose livelihood only improves if we
have complex and oppressive tax systems, for it is they who get work /
compensations when we go down that road. HK deserves better.
The
author would like to thank Tia Yik Ethan from The University of Hong Kong
majoring in Finance for assisting in data collection, analysis, and drafting of
this article.