2024年8月29日星期四

明報專訪 Mingpao Interview 1 of 2 - Global Economics + HK Property 20240822

聲明:所有傳媒發布的訪問內容只代表撰文者之理解,可能與本博客作者的分析或結論不同,或存有偏差。  

General Disclaimer - where quoted in media reports, your correspondent does not exercise control on editorial policy and therefore what appears in the publication may not coincide, or even rarely, contradict your correspondent's views...  

載於20240829

Bricks & Mortar Management王震宇:特朗普當選 港樓始有望回穩
【明報專訊】目前市場憧憬本港下月開始將跟隨美國減息,住宅樓市將會止跌回穩,地產股股價近日亦已率先反彈,後市是否真的否極泰來呢?去年5月初因應地緣政治風險升溫而看淡本港樓價的Bricks & Mortar Management主席兼總裁王震宇現仍維持審慎,他指未來兩年東北亞出現戰爭的風險不容低估,美國國債或會被拋售,10年期國債孳息率或升至雙位數,衝擊全球投資市場,亦不利港樓後市。他強調,除非特朗普勝出11月美國總統大選,取代現時的主戰派執掌白宮,減低全球戰爭升溫風險,始可考慮低吸港樓。

本港樓價去年首季回升近7%後,4月已轉趨橫行偏軟,Bricks & Mortar Management王震宇去年5月4日在本欄見報、題為「買港樓自住 要不怕樓價跌」專訪中認為,美國政府近年由主戰派當道,前年俄烏戰爭爆發後,未來兩三年東北亞出現戰爭的風險亦不容低估,提醒本港樓價有下跌風險。當時他表示:「若你的目標不是保本、唔驚樓價跌的話,覺得買樓自住帶來的安全感高於資產回報的重要性,你便去買吧!」該專訪見報以來,中原城市領先指數由去年5月初165.08點急跌逾16%至上周五138.61點,見近8年低位,可見王震宇測市準確。

珠玉在前,記者近日再邀請王震宇接受訪問分析港樓後市,而他仍然維持審慎:「美國11月進行總統大選前,我估計會有不少出乎意料的事件發生,原因是目前掌控白宮的主戰派不會容許共和黨候選人特朗普入主白宮,點樣可以達到此目的呢?主戰派料繼續在烏克蘭燃點戰火,以及令中東局勢進一步升溫,不排除導致緊張狀態,因此推遲甚至取消總統大選;即使順利舉行總統大選,最終亦可能像4年前般出現選舉結果爭議,各式各樣的可能性令是次總統大選充滿不穩定性。」

美日菲澳聯合軍演 勿低估東北亞戰爭風險

日本在1945年第二次世界大戰投降後,軍隊及軍事機構分別解散及撤銷,而在1947年頒布的憲法規定,日本不能擁有軍隊,因此自衛隊在法律意義上僅限為部隊而不是軍隊。

王震宇認為,在上述背景下,日本今年4月卻與美國、菲律賓和澳洲在南海舉行聯合軍事演集,類似而規模較少的聯合軍事演集近月仍持續,要思考背後的動機,故他相信,未來兩年東北亞爆發戰爭的風險不容低估。

國際投資者若拋售 美長債息率或見雙位數

除了全球戰爭風險升溫外,王震宇指出,由於美國政府過去一段長時間揮霍無道,需要發債填補巨額財赤,故目前國債規模逾35萬億美元,已超越立國以來以對數(Logarithm)比例運行的區間以上(見圖),這反映美國國債上升程度已經較內戰、第一次世界大戰及第二次世界大戰時快,這也代表美國現已很接近賴債邊緣。故王震宇認為,假如美國日後在全球參與戰爭規模擴大,令財赤進一步升溫,國債違約風險亦飈升,或觸發國際投資者拋售,屆時美國10年期國債孳息率或由現時的4厘以下升至雙位數,衝擊全球投資市場,本港樓市亦難免受累。

由於美國現時已債台高築,王震宇認為,即使未來2年東北亞不爆發戰爭,美國國債在未來5至10年的違約風險也不容忽視,他形容這是一或兩個世紀才會出現一次的大型危機,投資者宜密切留意事態發展。

特朗普主要關注經濟 與俄朝領導人友好

王震宇強調,美國11月總統大選非常重要,原因是假如特朗普獲勝,而他亦在明年1月順利重返白宮再任總統,料會改變美國現時主戰的作風,減低全球地緣政治風險,「回顧特朗普在2017至2020年出任總統期間,他關注的主要是經濟問題,故他不單與俄羅斯總統普京維持友好關係,亦與朝鮮領袖金正恩拍膊頭,這當然可以減低地緣政治及戰爭風險。」

記者翻查數據,本港樓價在2017至2020年期間錄得近兩成升幅,而2021年以來則跌近兩成。王震宇總結,只有中美關係好轉,本港樓價才有機會止跌回穩,故值得花時間真真正正去研究美國政治,尤其要關注特朗普能否勝出11月美國總統大選。


政府資助房屋供應大增 未來3年私樓市場最困難

【明報專訊】Bricks & Mortar Management王震宇認為,除地緣政治風險升溫等外圍不利因素外,本港樓市亦面對政策風險。根據本港房屋局數據,2024/25至2028/29年度公營房屋預測建屋量達14.68萬個單位,當中,逾三分之一屬資助出售單位。


王震宇分析,問題是目前私人住宅樓價已處於下跌周期,政府把如此龐大數量的資助出售單位推出市場,難免會令樓價跌勢加快,料未來3年會是市場最困難的時間,他又稱:「未來3至4年私樓潛在新供應達10.9萬伙,近歷史高位,政府的新供應也在這時間釋放出來,你估樓市會唔會冧呢?」

「代表私樓所有上車盤無運行」

有分析認為,政府對資助出售單位的買家設有入息及資產限額,因此資助出售單位未必與私樓競爭,但王震宇不同意,他認為:「即使設有入息及資產限額,但政府資助出售單位大增,也代表私樓所有上車盤無運行,這也會拉低比較高階的樓價。」

明報記者 葉創成

2024年8月22日星期四

主權債及難變現資產:危機一觸即發?

本文亦於2024年8月22日在【信報】刊登: 主權債及難變現資產 危機一觸即發


眾所周知,在投資領域,有拜於過去政府能夠無休止地印發貨幣來支付主權債息及還本所需資金,兼且以立法的手段強迫銀行、保險公司、退休基金等重倉持有國債,所以此一資產一直被視為最優質的類別,甚至被冠名為「無風險資產」(即Risk Free Asset)。但隨著過去幾年環球政府無節制地「先洗未來錢」,主權負債因而極速飆升,而此一假設亦終於成疑:

圖一:美國國債已高於二戰及內戰時高位!

如上所示,美國國債現已超越立國以來以對數比例運行的區間以上(即第二條藍線),負債總額亦已達35萬億美元的天文數字,此水平甚至遙遙高於過去美國在三次大仗後所累積的債務!更不利的是,第三次世界大戰似乎正箭在弦上,到時負債水平必再抽升

難怪中國儲備資產配置早已開始轉向購買黃金而不是隨時成為牆紙的借據:

圖二:中國黃金儲備倍升,美債比例減半


就如農林中金銀行見英文原文)這樣的大型非官方投資者亦開始嗅到債務違約的風險,並從2024年起拋售美債及歐洲債券…

債券投資失利 資金逃亡將臨

另一拋售來源則是退休基金,以前被催眠或受監管迫使而將超過80%資產投入主權債的各方基金現都被迫年復一年地將因零利率逆轉所致的市值計價債券損失入帳:

圖三:受聯邦存款保險公司監管的金融機構正承受史無前例的「未兌現損失」(十億美元)

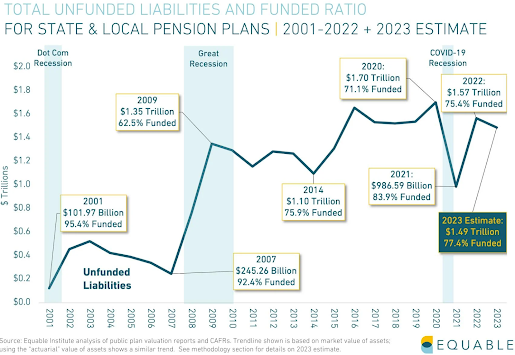
退休金其實禍不單行,市值計價損失之外,還要面對資不抵債的窘況,以美國州/地方退休基金為例,2023年資金缺口仍有25%之巨:

圖四:未撥備負債總額及比例持續高企


筆者預期大多數為了在零息環境下追求高回報而一頭栽進私募基金項目的退休金,現在都面臨難以套現的損失(見英文原文),除非能夠在巨額虧本下賤賣(見英文原文)資產。當下一場政經事件來襲時,這種流動性危機會更迅速惡化…
圖五:在下一場危機殺到前,應該超配左上角資產,減持右下角類別


地緣政治 + 通脹:下輪債券崩盤的元兇

各國揮霍無度所帶來的對債券是否安全的憂慮,加上去全球化和區域/全球衝突會導致的新的長線高通膨潮(下圖藍線)。以長期移動平均趨勢來看,此一波通脹潮似乎剛剛的開始:

圖六:高通脹加低信心將把主權債息迅速推向雙位數水平

但與先前的通脹潮相比,當年政府財務健康大大優於現在,因此下一個通脹循環很可能會出現市場拋棄國債資產的情況(上圖紅色箭嘴),轉向低負債而回報能對沖通脹的私人資產。

以上乃是為何筆者更看好商品和農地類資產的主因。事實上,即使短期看淡高度金融化的地產市場(如倫敦/香港/新加坡等),實體經濟內的有形資產亦有機會因資金逃離主權債而轉跌為升!換言之,當主權債務危機爆發時,事前的樓價下跌,將迅速變為樓價大幅飆升的終局。

筆者特別鳴謝香港大學會計及財務學系許淳茵同學協助收集及整理本文相關數據及圖表。


2024年8月15日星期四

Is the F&B trade oversupplied in HK? 20240815

Lately we often hear how bad the retail scene in HK has become, and indeed a stroll down main thoroughfares around town reveals just how many boarded up vacant shops there are, even in formerly very busy precincts. So how bad has the food and beverage (F&B) landscape been? We take a look at how the numbers and make up of licences in the industry to pin down any emerging trends…

What surprises us initially is how the total number of licences have continued to increase in HK despite the severe lockdowns and the current weak economic performance – at end-2023 there were 33,536 outlets in the city, up a substantial 19% against pre-lockdown 2019:

Chart 1: No. of licences over time, and restaurant receipt changes (grey area)


Chart 2: No. of licences – Others sub category

In fact, neither the social unrest nor the lockdowns made any dent in the over army of F&B outlets in HK, whose numbers have basically increased non stop for the past quarter of a century!

Top winners have much to thank harsh lockdown policies

Because of the combined adverse events of the unrest and lockdowns, it is very appropriate to compare numbers against 2019 levels. Amongst the various categories of F&B licences, three strong winners stick out, and they are all beneficiaries of isolation/curfew/lockdown related policies that ruled the ‘covid years’:

a) Cold stores – as lockdowns and work from home (WFH) took grip, more and more people opted to take away and cook at home in the period 2020-22, resulting in a massive 41% spike in outlets that sell refrigerated foodstuffs (red bar, Chart 2);

b) Food factories – along the same vein, food factories swelled by 34% thanks to people buying more ready to serve/cook meals instead of dining in (orange bar, Chart 1);

c) Fresh provision shops – trying to eat healthy and cooking at home (as strict lockdowns prevented dining out) made this type of outlet popular, which as a result rose by 29% in the past 4 years (dark green bar, Chart 1).

Social distancing killed the sweet tooth!

The most unexpected losers in this changed dynamic was how commuters disappeared and with that bakers (presumably people bought their buns en route to work before), which were down 14% (light blue bar, Chart 1), followed by frozen confection entities, may be because there were no birthday parties or office outings, or other celebrations (purple bar, Chart 1).

Viewed in proportional terms, here is a graphic illustration of how each component of the F&B industry fared in the past few years (red arrows = expanded, blue arrows = shrank):

Chart 3: Relative weighting of F&B categories over time 

One driver of the rise in food factory category was also due to how consumers have felt poorer in the intervening years, resulting the sudden popularisation of the so called ‘Rice with Two Sides’ outlets, which mushroomed everywhere, and selling each lunchbox set for as low as $25; if you felt like pampering yourself, you might splash out and bought ‘Rice with Three Sides’ for $35!

Retail rent cannot be willed into rising despite the economy

It is easy to blame the landlords for ‘unconscionably’ high rents and coldblooded disregard for retail livelihoods, as is often heard on the media. However, just looking at how restaurant receipts have changed and how sympathetically retail rents have tracked it, one can only say that rents are very much a product of the market – if tenants can’t make money, then so can’t the landlords:

Chart 4:  Retail rent index actually underperformed restaurant receipts in the past 18 years  

In fact the total F&B receipt index is up 94% since 2005, but retail rents over the same period was up a more measly 75%...

So, if rents are not the culprit of the current F&B malaise, then what is the real problem? We hypothesise that it may be the combined effect of lack of innovation and moving up the value chain, and the southbound invasion by cheap and competitive mainland brands:

Chart 5: Retail rent index vs Restaurant receipt index  

What is clear in the chart above is that despite rising nominal receipts (red line) in the past two decades, the real income has stagnated for most of that period – with no rise at all since about 2008 (green line), then the social unrests and lockdowns became the final straw that broke the camel’s back, taking the real returns for the industry as a whole from 150 to 120 now (ie a 20% decline).

What is more alarming is how the total number of outlets continued to grow despite the savage lockdowns – the licence numbers have basically grown uninterrupted during the whole of the lockdown years (blue line). As a result, the per outlet revenue has fallen a more dramatic 30% from the mid 2018 highs to 818 now. 

Perhaps there are mix issues obscuring the numbers – for example more smaller eateries have surfaced while the industry wide capacity is reduced by larger restaurants going out of business (such as whole-floor Chinese dim sum restaurants), not to mention more licences being out of retail premises and residing in industrial properties in the form of factory kitchens. What is certain is that there is a huge amount of recovery yet to take place in HK’s F&B arena before we are genuinely ‘back in business’.

The author would like to thank Huang Ying Fung from Hong Kong University of Science and Technology majoring in Accounting and Finance for assisting in data collection, analysis, and drafting this article.


HK tourism/retail – hostage to the strong peg

 Recent statistics on visitor arrivals in HK have been positive, with all months year-to-date reporting higher numbers compared to 2023 (brown line below): 

Chart 1: some good bounce from Covid lows, but visitor arrivals still well down from 2019 levels

However, we are still quite a large gap down from pre-lockdown arrival levels (ie in 2019). Even though comparables will become easier later this year, due to the adverse effect of social unrest in Hong Kong in H2 of 2019 (purple line) on visitation.

If we take H2 2018 as ‘normal’ market for H2 (see black line), then the gap from here remains very large indeed.

PRC recovering faster, but much room to make up for

With Chinese visitors now making up the bulk of total arrivals, their resumed enthusiasm for HK as a destination is certaintly encouraging, but even a return to the down trend top requires some 60% further increase from current levels, let alone recapturing the peak reached in 2018: 

Chart 2:both overseas and PRC visitors need big jumps to return to pre-lockdown levels

What is more challenging for HK still is how the spending pattern has also moved against tourism income for the city – despite high inflation over the past few years, the average spend per tourist has gone down, no up – the per capita spend is now at $4,154, down 18% from the 2013 highs:

Chart 3:both total spend and per capita spend by tourists are lower vs the hay days of 2013-14

Part of this trend is driven by a combination of increased availability of luxury goods in the mainland as more brands open shops in major cities, as well as more strict enforcement of cross border parallel imports by the PRC Customs. Of course, the poor economy up north, together with a property market that has contracted for several years do not bode well for generous spending either.

Strong USD to remain strong headwinds for tourism revenues

In the near term, the stronger US economy versus the rest of the world means US interest rates will likely stay high, whereas rate cuts have become the norm in emerging economies, especially China. This may drive further weak currencies against the USD, making goods in Hong Kong even more expensive for visitors:

Chart 4: higher USD usually means lower visitor arrivals

As can be seen from the chart above, stronger USD results in fewer tourist arrivals. Another factor that may help the USD stay strong is the continued geopolitical conflicts in both Europe and the Middle East, resulting in more capital flight into the dollar.

Strong USD continues to drag on HK retail rents

Currencies do not only affect arrivals, they also impact resident departures – it is now almost taken for granted that the locals frequent their favourite shopping malls or entertainment venues in Shenzhen during weekends. In the meantime, the price adjustment that HK businesses have to go through must take the form of income reduction rather than through currency depreciation thanks to the peg between HKD and USD. As a result, retail rent may continue to face pressure as long as USD strength continues and visitors as a result continue to stay away:

Chart 5: lower visitor arrivals => lower retail rent

This set of conditions echoes our call that HKD should adopt a Singapore style managed float rather than a very inflexible fixed peg, which while provides more visibility and certainty, can do more damage to the economy when the American monetary policy is progressing in an opposite trajectory to the economic realities that we face here at home.


The author would like to thank Janice Chu, currently studying for a BSc in Computational Finance and Financial Technology at The City University of Hong Kong for assisting in the data collection and analysis in the writing of this article.