2022年9月30日星期五

Which US states are tax friendly… and cheap? 20220930

 As interest rates spike and cost of living crises bite across the world, it is even more important now to choose one’s investment (or living) destinations carefully. On top of the usual comparisons of tax rates between jurisdictions (see earlier article “LowerUS State Tax Drives Population Inflows, Home Price Rises”), this article employs a slightly different angle – the composition of tax takes between host governments. We undertake this exercise using Tax Foundations’ data which breaks down state tax income by four main components: corporate income tax, individual income tax, sales tax, and property tax.


Preferring low income tax and fair individual-corporate balance

For most income earning job holders who may also be home owners, it may be reasonable to assume that they prefer paying lower income tax. On top of that we would also assume that when individuals are paying similar (or lower) levels of tax compared to companies, the smaller guy (individual) would be getting more fairly treated or allowed more individual liberty.

One way to quantify these preferences is to plot these preferences on a scattergram using two measurements:

  1. Higher sales tax take vs income tax – meaning more of the government’s income comes from consumption rather than savings, thus encouraging investment for longer term if not implying low absolute income tax rates, this is captured below on the X-axis;
  2. Lower individuals tax than corporates – put another way, this state of affairs results either when there is a booming corporate sector (leading to higher corporate income taxes) or when the resident individuals get to keep more of their salaries/profits instead of just the big corporates being able to do that (as they have the clout/resources to negotiate/threaten govts into large tax concessions) – this metric is captured on the Y-axis:

Chart 1: higher sales & corporate tax takes vs individual taxes are ‘good’, and vice versa

The spread of the scatter is surprisingly linear, and we have highlighted the ‘desirable’ end of the spectrum in red – states that fall into this category include: Texas, Wyoming, Nevada, Washington, South Dakota, Tennessee, Florida, Alaska and New Hampshire.

On the other extreme (the high individual tax states) we have these ‘bad’ states in purple: Oregon, Maryland, Massachusetts, and Delaware, Virginia, and New York.


States with low income tax AND low property tax

For property investors, lower property tax burden is also an important consideration, so this is what we did next - bombining the two metrics from last section into one (now represented by % sales tax + % corporate tax - % individual tax x 2), and then comparing the result to the proportion of state tax income from property. The results are shown in the chart below:

Chart 2: winners from last section which are also low property tax states – represented by red text in orange shade

The results are interesting – the number of states that meet both low income tax and low property tax criteria now falls, with Tennessee, Nevada, Washington, South Dakota, now the remaining front runners and Florida just scraping in. A new entry however has popped up in the form of New Mexico (represented as N.M. above), which has one of the lowest property taxes (plus great weather) so may well be a good choice too for investors who are not earning a big income? On the opposite end of the spectrum (unfavourable individual tax states), Delaware has lower property tax burdens also, but probably not ideal for the average middle class property owner given its reputation of being a corporate tax haven… the other regulars which score badly on both fronts are Oregon, MA, and Montana.


Internal migration proves thesis right

To prove our hypothesis that the above identified low tax states are indeed attractive, we take a look at how domestic migration played out in recent years. As a percent of state populations in 2017, we look at the proportional net internal migration numbers and use this statistic as a proxy for how people either flock to, or flee from individual states. Here are the results

Chart 3: Low tax states attract population inflows

Perhaps not surprisingly, our ‘attractive’ states (in red text) invariably saw net domestic migration versus the high tax states (purple text) seeing outflows. So our top 3 states (from Chart 2) are also states here with the highest population inflows (Nevada, Florida, Tennessee), whereas the bottom states also saw meaningful outflows (Maryland, New York, and MA).


Housing price to income ratio

To add icing on the cake, cities from some of our top states also appear on the cheapest housing market list – according to the 2022 Numbeo home price to income ratio rankings, the good affordability cities (ie with low multiples and high rankings) seem to feature our top states from the foregoing analysis, while the reverse seems to be the case for the expensive cities. In the chart below, the number in brackets after the city is the ranking number out of 40, and the colouring follows the same scheme we have used in the earlier charts:

Chart 4: Home price to income ratio – affordable tax states also have affordable homes?

This may sound too good to be true, but if the trend of continuous inflows persist, perhaps the cheap home price states will not stay cheap for long…


The author would like to thank Jasper Tan Cheuk Him from The University of Hong Kong majoring in Economics and Finance for assisting in data collection, analysis, and drafting of this article.

2022年9月27日星期二

比特價飄忽莫測 新模型漸見準繩 20220927

本文亦於2022年9月27日在【信報】刊登:比特價飄忽無常 新模型漸見準繩


2017年投資虛擬貨幣(亦稱加密貨幣)開始膾炙人口,預測比特幣價格走勢的需要亦越趨殷切。而最常用的方法莫過於線性推演(linear projection)。然而,要得出較接近的預測結果仍有其他途徑,筆者透過多年來分析與投資此一資產的經驗,在此總結如何逐步優化預測方法以獲得更佳預測結果,希望能更廣泛地應用於所有加密資產上。

對數還有對數高

Excel高手應已熟習將線性圖(linear charting為對數尺度(logarithmic scale以更易模擬及解讀數據中之趨勢。此亦正是筆者於2017年開始預測比特幣趨勢時之首選工具。縱使實際價格與預測走勢之間仍有較大的偏差(特別是201020142018,及2022年價錢衝頂及觸底時段),此預測方法仍有不錯的參考價值:

圖一: 以對數趨勢預測比特幣走勢——契合度不差

然而時移世易下,比特幣價格似乎逐漸不依循線性對數規律增長,導致此粗陋的預測方法愈來愈不準確。偏差自2018年跌市後尤其明顯。

有見及此,筆者改為以高次方對數模型來推算:以三次方多項式程度來看,【圖一】中2010-1年間藍色橢圓區非常大的偏差已能很滿意地被新方法模擬(見【圖二】同時間之藍色橢圓區)。同時,雖然圖一】中2015-6年陰影區域的預測偏差不大,但圖二】卻更貼近長線趨勢正在放緩這一事實:

: 三次方對數趨勢預測比特幣走勢——更高相關性

新方法的優勢亦由趨勢線與實際價格之間的平均差距大大改善可見一斑:由採用線性分析時的168%減少至現時69%


可惜,隨著走勢中一個又一個價格週期的累積(由2010年至今已可數出4個市頂及4個市底),只靠三次方模型已不敷應用。透過在趨勢方程式中加入更高次方雖然得以增加預測的精準度,但此法最終會追不上更多價格周期所帶來的複雜性!儘管如此,再度升級後的五次方模型(平均百分差由69%再減少至62%)暫仍可敷應用,見圖

: 五次方對數趨勢預測比特幣走勢——再下一城!

上圖藍色橢圓區顯示了多次方模型捕捉多個轉折點的優勢:新的趨勢線現在能捕捉到2022年下降周期,此是先前各模型所不能達到的。


存量供應比模型亦有瑕疵

另一個較出名的預測模型採用存量供應比概念。即是以比特幣的存量除以其供應量作函數來估計比特幣的價格,如下圖所示:

: 存量供應比模型

資料來源: https://buybitcoinworldwide.com/stats/stock-to-flow/


此模型成效如何在此且不作討論,但上圖中明顯可見,預測線與實際價格存在不少甚大的偏差。而且,這些偏差經常突然出現,兼與市場狀況並無關係,而是由比特幣規程內置的供應減半機制所造成的。

有見於此,筆者決定以更能反映基本因素的方式去預測比特幣價格的走勢。


無論歸類商品或金錢,都受貨幣供應影響

不論炒家或投資者或者都意識到加密貨幣價格與資本市場的走勢間的相關性正在日益增加,並同意資金鬆緊程度將對加密貨幣的價格帶來越來越大的影響,尤其當現時加密資產市值已以兆億美元計,而不是幾年前的十億或百萬美元單位。

換言之,預測比特幣價格應將貨幣供應作為一項重要的輸入函數。其他舉足輕重的變量包括:
一)非零餘額比特幣地址的數量——用以代表比特幣的應用水平,及使用率上升能帶來的網絡效應;

二)比特幣存量——雖然數目仍在增加,但速度正在有序地下降。就如現實生活中的貨幣一樣,過多的供應會導致銀紙貶值及通貨膨脹。

為量度以上三項函數的整體相關性,筆者將之繪於同軸圖上以作比較:

: 比特幣價格三因子——需求(地址數量)、供應(發行量)及動力(貨幣供應)

顯而易見,比特幣的發展過程中,個別因素將在不同階段對其價格產生不同的影響。例如,於2010-2年比特幣增長最快之時,地址數量之影響尤其大;但長遠來看,貨幣供應卻是決定未來價格的主宰因素,尤其是在不久的未來當用戶和供應的增長都趨向平穩。


在編制貨幣供應函數時,筆者暫只加入全球前五個經濟體之數據。當然,涵蓋更多國家應可得到更全面的結果。以下為貨幣供應量(M3)排名前五名國家的組成:

: 全球M3貨幣供應量排名前五名國家(十億美元)

或許令人詫異的是,中國的M3貨幣供應量竟然比美國還高,且差距甚大。緊接其後的為歐盟及日本。英國與印度與前四位又再差一大截。此五大M3經濟體合共貢獻全球55%生產總值—或者將成員數目增至67%或以上佔比能加強模型的準確性?


比特幣的大統一理論?

綜合以上論述,將三大函數整合後便得出以下新的比特幣價格走勢線:

: 改良版比特幣價格預測線

可是,實際價格與走勢預測的偏差仍然存在,直至筆者將M3因素的比重增加(畢竟,印鈔才是推動貨幣貶值的最大元兇),以達至以下較為滿意的結果:

: 以「大統一理論」模型預測的比特幣價格走勢

經過改良後,以「大統一理論」模型推測的誤差已從第一個版本的66%降至55%;以傳統資產的標準衡量偏差仍大,但在以上過程中已形成一些進一步改良的方案,若能取得足夠的進展,將另文再述

「大統一理論」的好處在於:

) 它不是由純粹的統計方法模擬的
) 輸入的函數與現實相關且是獨自可量化的
) 輸入函數的升跌更切合資產價格之波幅,這是單靠統計方法無法模擬的

也許在不久的將來,此模型將成為一個成功的投資策略一部分;但同時,完善比特幣價格預測模型的工作尚未完結。以下,本文將以一個神秘圖表作結:此模型似乎解決了指數增長衰減的困難:

:線性化比特幣價格趨勢終於有成?


本文早前出版的英文版本可在細閱。

2022年9月26日星期一

地產站Weekly Talk 息口長升長有 王震宇:未來1年樓價最多下插逾1成 20220926

2022年9月26日

香港經濟日報記者 潘淑盈

美國聯儲局再度加息0.75 厘,一如市場預期,有本港銀行已率先調高最優惠利率 (P)。

Bricks & Mortar Management 創辦人兼總裁王震宇認為,一、二手交投料持續偏弱,直至政府再放寬入境檢疫措施至「0 + 0 」方案,兼中港通關,才可減低加息、通脹對樓市的負面影響。他初步亦料未來半年至1年,本港樓價最多或跌逾 1成。

王震宇估計,未來半年至1年半,美國趨向繼續加息,在此情況下,很多買家要重新「計數」,及衡量他們的負擔能力,因此預計二手成交量會繼續偏軟。不過,他強調,除了國際利率環境、本地經濟或房屋政策的變數都是影響樓市交投的因素。

他又指,過去數月成交量基本上觸及過去57年的低位(以成交量較總存量計算)估計這情況應該會持續23個月,直至政府再放寬人境檢疫措施至「0 + 0」方案,兼中港通關,才可減低加息、通脹對樓市的負面影響。

政府有「辣招」撑經濟隨時可撤

他直言,過去一段時間中原城市領先指數 (CCL) 已跌穿數個重要的支持位,估計短期內會繼續下跌,惟因政府手上還有很多「辣招」,故亦不該太過悲觀。若勢頭不對,或為了支撑經濟,當局可能隨時「撤招」,就如以往將細價住宅的按揭保險成數提高至9成等。

他認為政府依然有很多措施可做,問題只是視乎當局想「托市」或讓樓市繼續下行,但暫時看不到新特首在房屋有何大理念,所以暫時需要觀察。他依然估計,未來半年至1年,本港樓價或錄單位數至10多個百分點的跌幅。

料美明年中 加息至4.5厘以上

在加息周期,市場觀望情緒升溫,未來新盤是否會偏向保守?他認為,如果新盤未能去貨,發展商一定要跟隨市場價發售。目前息口環境非常不利,發展商不可能無限期暫緩推盤,所以估計他們屆時需向現實低頭變相要以貼二手價或低於二手價推盤,才可去貨。

美國於今年餘下時間很大機會再度加息,他初步預料,美國聯儲局明年中會加息至 4厘半以上。若香港銀行要賺取約 200 點子的息差按揭息率隨時達6厘半或以上,「過去一段時 間習慣低至7080點子的息率,因此他們需要大幅調節心理及『荷包』,估計需要一定的適應期。」

他預測,香港銀行屆時一定會再上調最優惠利率,因為剩餘的安全空間不多,估計香港銀行最快今年第4季、遲則明年第1季追加,並預測香港跟隨加息的幅度與美國的相同。

租金幾乎「跌定」入市工商舖時機

            疫情「打殘」工商舖市場,王震宇認為,投資者現時入市工商舖較買住宅更精明,因租金已經差不多「跌定」。

投資安全系數 較住宅高

            王震宇認為,在封關下,工商舖市場的交投及租售價大幅下跌,甚至重回 2004 2005 年的價位,安全系數較住宅高很多,所以他覺得,對於投資者而言,人市工商舖較購 入住宅更精明。「銅鑼灣最旺街道的租金下挫,以往舖位均由國際名牌租用,但目前只由短租舖或散貨場承租,可見價位己經差不多見底。」

            在加息周期下,准買家又該如何部署?他建議準買家做足研究,並需「計好數」,以防輸掉儲蓄,亦不能只選擇價錢相宜的供款計劃,而需考慮未來環球經濟表現、戰爭會否加劇、通脹率等因素才入市。

籲增私樓供應 樓價或下調

            另外,新政府將於10 月中公布第一份施政報告,他對此有何期望或建議?他坦言,政府應該盡量增加私人房屋供應,因為公營房屋售價可謂根據私人房屋售價而定,只要令私人 住宅的樓價下跌,增加公營房屋供應的壓力會減少,並建議政府該撥部分公營房屋到私人市場出售。此外,政府亦不該「衝出去托價」,又舉例近期有私人住宅地流標收場,就是政府「抬高地價」的表現,最終令樓價難以回落。

同時他表示,政府不應增設更多樓市「辣招」以管理樓價,相反提供足夠房屋供應才是更實際的做法。


報導來源:HKET- 地產站Weekly Talk 

特此鳴謝

香港經濟日報記者:潘淑盈

攝影及剪接:梁鑑章 羅志聰

文章來源: HKET

請前往作者YouTube頻道觀看更多視頻: 王震宇宇論 Yulun


2022年9月20日星期二

Reiterate UK sell – prospects dimming fast 20220920

Since our 13th May bearish call on UK property, things have not improved on any front, and in this report we update some important macro factors that have either added or worsened the property headwinds the UK is facing. We urge investors to speed up their disposals before it is too late to do so.

Several of the key factors impacting the outlook of UK, and in a sense Europe at large, continue to play out and the current lull (helped by both summer warmth and a temporary correction in energy prices) may reverse unexpectedly when winter arrives. Here are what could happen:

  1. Energy starvation undermines livelihoods, triggers civil unrests?

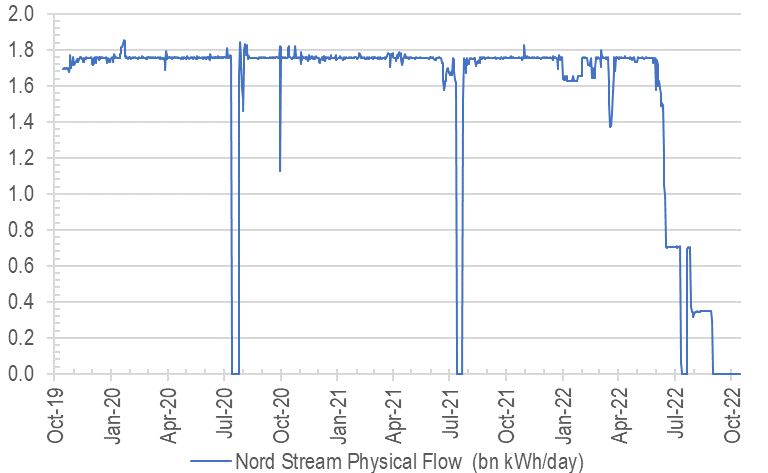
The unfortunate situation Europeans find themselves in can best be described as  a combination of: a) political grandstanding in Ukraine where sanctions beget retaliations (energy & food shortage) from its biggest supplier (Chart 1), while b) the zealous embrace of fundamentalist ‘green’ energy policies without having backup plans worsens the hardship that can potentially explode on to the scene.

Chart 1: Nordstream gas turned off – is it lights out for Europe? Source: Nord Stream AG

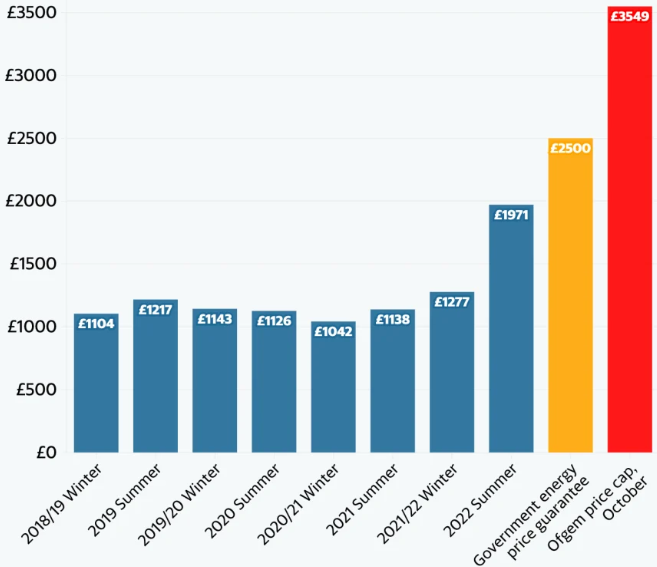
Focusing just in the UK, our subject market, where 40% of electricity is generated from natural gas in 2021, the energy bills for households and businesses are going vertical (Chart 2). An outcome that would have been avoided if the UK did not gleefully hitch the joy ride that expansionist/hawkish US / Nato policies brought about when diplomatic solutions have been in place since 2014 (ie the Minsk Agreement brokered by France and Germany).

Chart 2: UK gas prices tripled vs a year ago

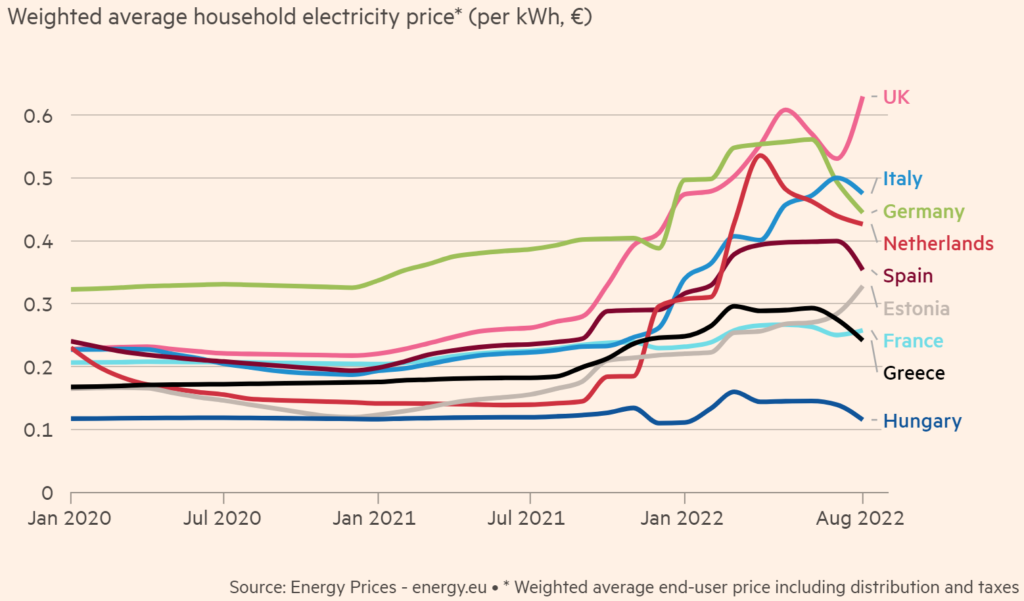
Chart 3: UK electricity price highest in Europe

Now European countries not only have to suffer manufacturing stoppages due to energy shortage, but also issue even more debt to relieve household energy hardships at a time when cost of funds are exploding (more below), all while spend unnecessarily on a costly arms race in an unnecessary war which benefits mostly foreign (ie US) energy and munitions producers. This is as close to a perfect storm as it gets, coming on the heels of devastating lockdowns that has destroyed the SME sector in the past three years and ushered in record high inflations (also expanded later, Chart 3) even before the war began…

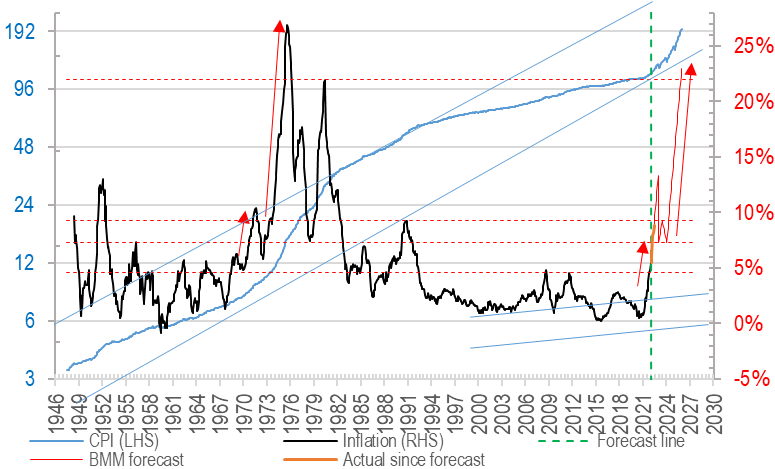
Chart 4: UK inflation: tracking the the crazy 70s inflationary cycle?

2) Interest rates bursting out of CB control

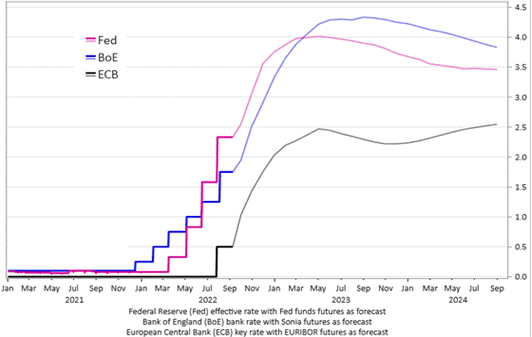
As the Fed aggressively pursues neutralising rates after years of QE, the rest of the world is dragged along with it, with many EM countries flirting (if not already in) double digit interest rates territory. In the UK alone, it is widely expected now some 250bps of hike is on the cards by Q3 2023 (Chart 5), we fear that might appear mild if the sovereign debt crisis worsens.

This will force a repayment crisis for any home owner on high LTVs who will already be seeing their disposable income drop due to high inflation.

Chart 5: Central bank rates in the west projected to hike
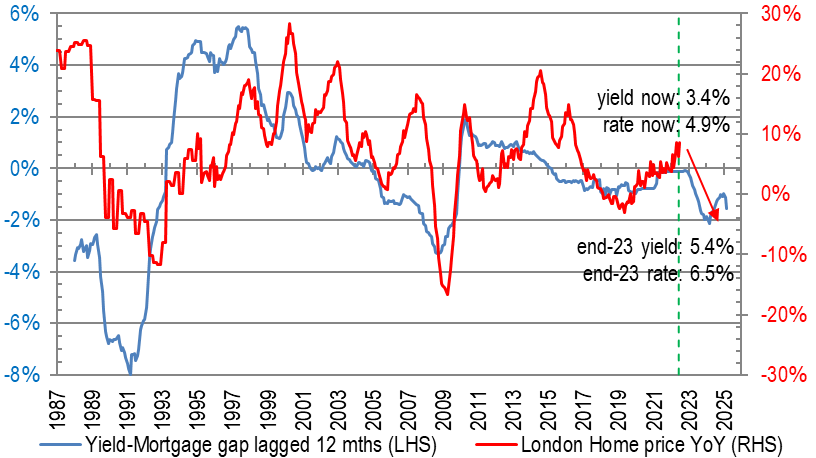
Chart 6: rental yield lagging mortgage – negative for prices

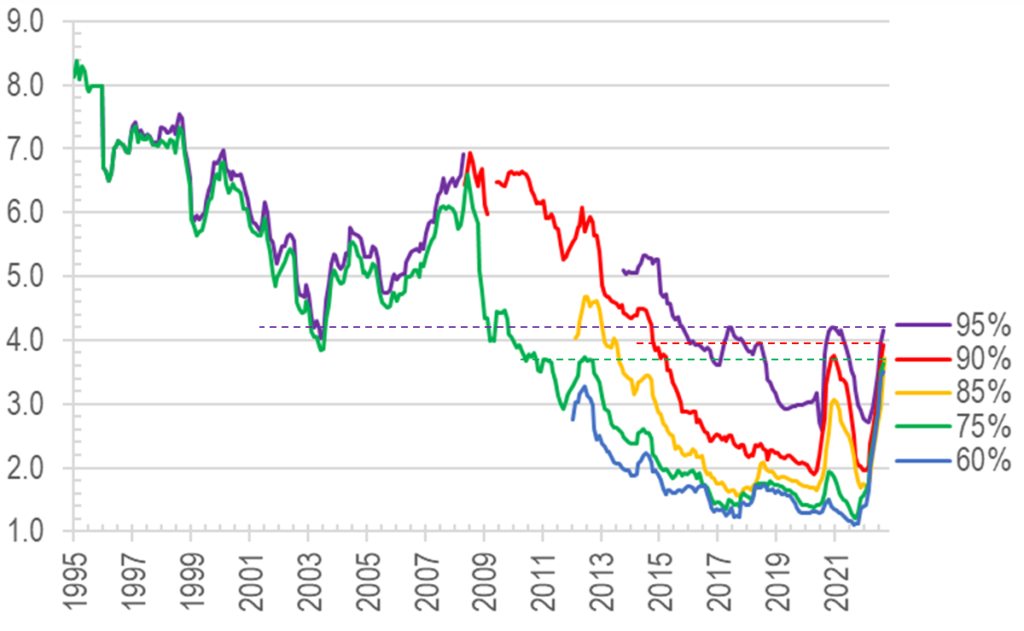
As a result, property yields will have to rise either through big rental hikes (eg in Chart 6 above, c.60% if prices were to stay flat) or some meaningful price corrections heading into 2025. This hike in funding costs will hit even owner occupiers (who may be less concerned with yields discussed just now), as their repayment instalments have only just taken off, and could see multi-decade highs ahead, here is a taste of the rapid ascent and what it looks like:

Chart 7: UK mortgage rates by LTV levels - variously at new highs since 2002-2015

3) Economic shrinkage unavoidable? Unrest/war wildcards on top…

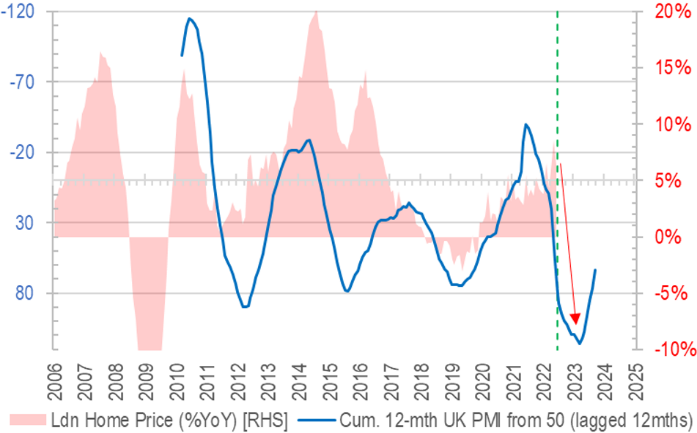
Given the set up of these very unpalatable cocktail, it is unsurprising that our sentiment momentum tracker is suggesting price drops into H2 2023 (Chart 8) and finance directors are getting more bearish (see Chart 9 – again, we expected weaknesses ahead back in May, but this may persist for a few more months to come), which can spell trouble for investments and consumption ahead.

Chart 8: Fast dropping PMI bodes ill for home prices
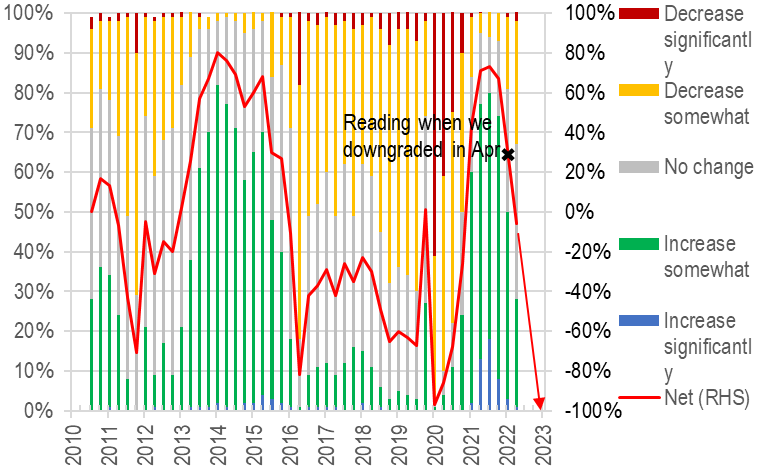
Chart 9: CFO survey – weak sentiments weakening further

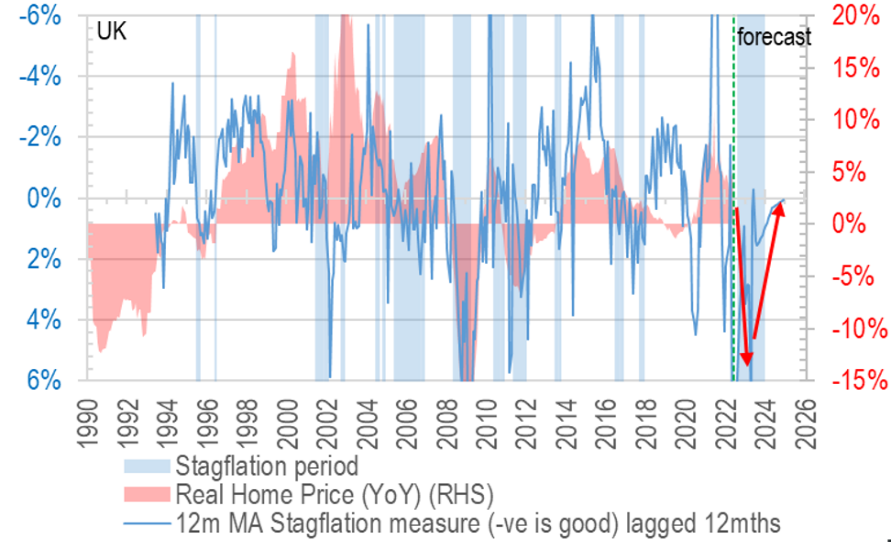
To put all of these indicators on one consolidated view, it is helpful having our ‘stagflation chart’, which encapsulates both the expected weak (if not negative) household income growth and rising unemployment, we see a lot of downside risk indeed:

Chart 10: Stagflation flags point to real home price to fall in 2023-24

4) The weaker the GBP, the more imported inflation – a vicious cycle?

On top of the lacklustre macro picture overall, the currency headwinds are not to be overlooked either – as UK suffers the multiple disadvantages of wrong geopolitics and woke/green misadventures, less investment will head for the British shores, or if there were fleeing EU money, they may bypass the British Isles this time and head straight for the USA instead.

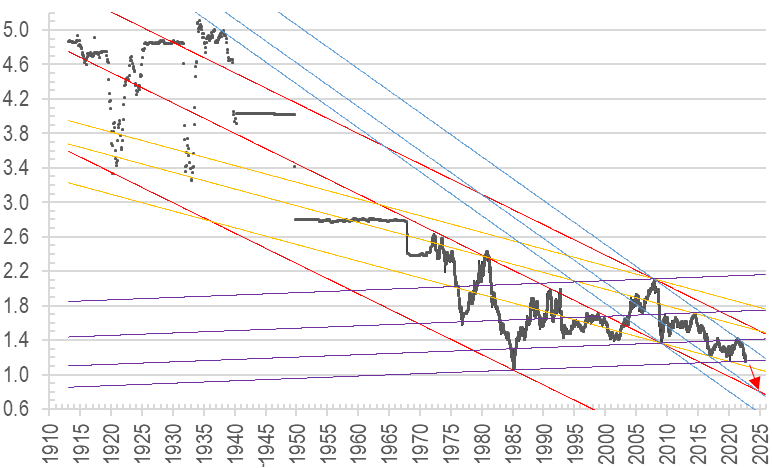
What this means is that, especially for foreign investors (which is everyone buying UK property from HK), more currency losses are possible on top of price drops in local currency terms. In fact latest falls in GBP has broken a long term support level that hs held since the 1980s:

Chart 11: GBP could fall another 25% by 2025 after piercing long term support

With this major technical breach, we could be looking at the pound reaching 80 cents on the dollar within the next two years, or another 25% devaluation. A familiar Christmas carol paints a serene scene like this:

In the bleak mid-winter
Frosty wind made moan;
Earth stood hard as iron,
Water like a stone;
Snow had fallen, snow on snow,
Snow on snow,
In the bleak mid-winter
Long ago.

Let’s hope this scenario does not come true this winter…and the politicians will have the wisdom to reverse so many bad policies that could result in just such a bleak mid winter indeed.