HK property is facing significant challenges, in the new reality of being increasingly viewed as 'another Chinese' city. Will this mean prices will fall more than its brethren in the north (or rise less if market turns up) henceforth? We look into a number of factors that influence the outcome of this interesting investment dynamic, perhaps starting with the bad news first: 1) Chinese outbound tourists bypassing HK (bad)? As more relaxations are introduced/restored for visa free entry to global destinations (right column in table below), PRC tourists may bypass HK even more and head for exotic climes directly:  This trend of disintermediation, is also manifesting with more overseas countries given visa exemptions for visiting China (left column above), a factor further compounded by increasing flights from gateway PRC airports to overseas cities, reducing the hub role HK has long come to enjoy. 2) Rising retail standard + cheap RMB => surging northbound HK shoppers (bad) As amply illustrated in article 1 below, increasingly sophisticated retail offerings in PRC cities, more spacious physical hardware, (sometimes) better services, and of course cheaper cost is now triggering a new phenomenon where HKers go spend weekends in SZ for leisure and even for grocery shopping. In office space alone, more companies may be tempted by the now Grade A spec but much more affordable occupation costs up north:
HK office costs are still 3x prime SZ equivalents, which coupled with cheaper labour, may entice increasing numbers of businesses to set up north of the border - especially if travelling on the High Speed Rail, one can be in Futian from Kowloon West in a matter of 14 minutes, on fares (book yours here) cheaper than the cost of a cup of Starbucks ... It is worth noting also that occupancy costs fell across the board in the China/HK markets in Q4 23, compared to mostly rises in other global cities - showing how weak the domestic economy was then, and why the Chinese govt had to pump prime to save the property sector in recent weeks. 3) PRC rate cuts vs Fed rate hikes (bad) We have long maintained that wars and deglobalisation will only worsen inflationary pressures, and that this would leave little to no scope for rate cuts by the Fed:
What's more, the still high real interest rates in China allows it ample further scope for credit easing - some 150bps vs US, and nearly 280bps vs UK):
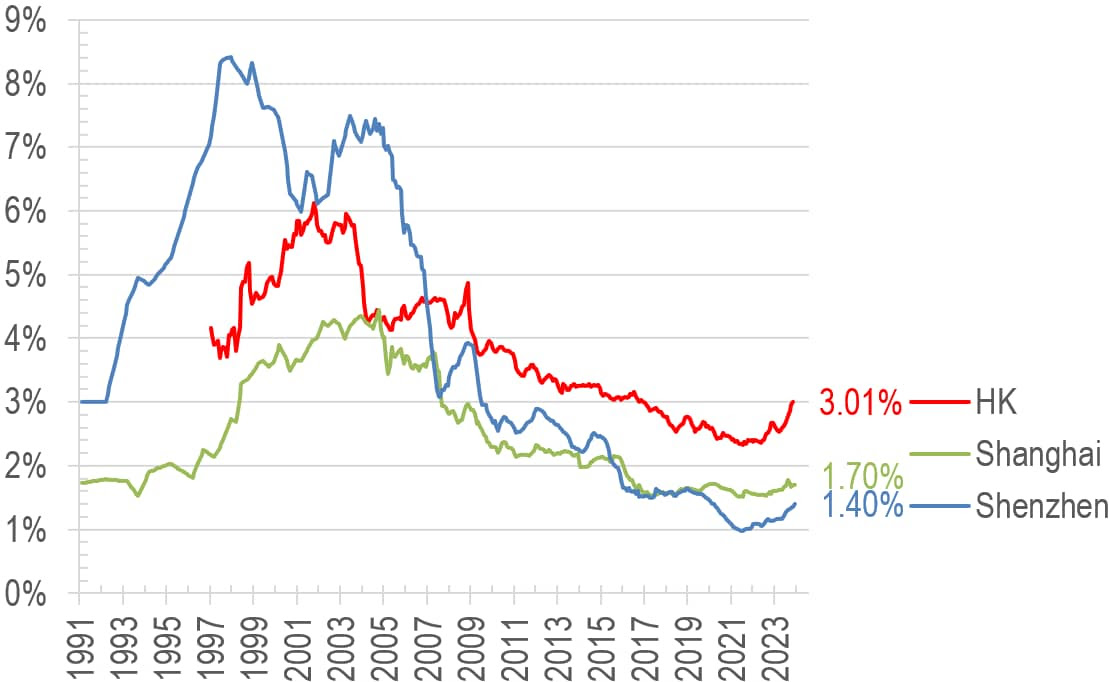
The conclusion of this rate trend divergence is best illustrated in the chart below:  Whenever HK rates hike less than PRC rates (green arrows pointing up, eg 1992, 2006), HK prices tend to rise much faster (red arrows up). The reverse is the case when HK rates rises more above PRC rates - which is where we are now - prices underperform SZ (eg 1996, 2013 to date). With the rate picture increasingly looking like HK rates staying high while China cuts further in the coming year (rightmost green arrow above), HK residential premium over SZ will likely shrink further in the coming two years. 4) Facilitating Southbound flows (good) The HK govt has been tapping into the rise in PRC wealth and talent by attracting them to settle in HK (article 2), but this is not radically different from some other immigration schemes already in place, and perhaps does not have as strong an impact as in earlier years. Similarly, attracting more southbound shoppers is nearing its potential (we already have 49 cities on easy travel arrangements, see article 4), and thus will unlikely result in any quantum leaps with further relaxations. 5) Higher SZ base good for higher HK too (good) As can be seen below, the premium in HK prices remain quite substantial over SZ for comparable luxury estates (Residence Bel Air in HK vs Seaworld Shuangxi Garden in SZ):  Whilst global comparison suggest that our current 120% premium may be too high - eg NYC Midtown is 50% premium over San Fran, and 63% premium over NYC Downtown - perhaps the shrinkage of the HK-SZ premium is largely done. Hopefully SZ price increases will do most of the catch up work rather than even deeper HK price drops... Looking forward, we think a combination of the two remains the most likely scenario; here the Price-to-income ratio trends suggest that SZ prices will improve by some 12% in the coming year or two whilst HK might see a larger 30% correction. For HK, the bulk of the improvement will have to come in price correction rather than income growth:  6) Yields already safer than many global cities (good) A saving grace for HK at least is that its real property yield is already quite 'reasonable' when viewed in the context of real property returns:  Above table is updated to December, showing that high inflationary pressures in places like Tokyo and London is destroying returns on rentals, whilst both SZ and HK sit reasonably happy in positive territory near the top of the pile. Generally high real return markets are more sustainable pricewise than -ve yielding ones. The higher nominal yield in HK (3%) also means that the higher interest rates here in the longer term will make for a healthier market when SZ's paltry 1.4%:
7) final technical look - SZ might do better medium term? On a long term technical perspective, SZ could continue to play catch up, but we await price action to give the next signal (either pierces the green support or breaks out of the blue resistance) before jumping into investment action. The answer might show itself by as early as mid-2024:
Given various headwinds in primarily geopolitics, perhaps investors are best to diversify into commodities and low conflict risk jurisdictions, exactly what we have been doing for the past 2-3 years... ==================Article 1================== Hong Kong vs Shenzhen: a day of food, drinks, sightseeing and leisure compared – how much cheaper can the mainland Chinese city be?The recent jump in people heading from Hong Kong to Shenzhen at the weekend suggests you can enjoy a lot more for much less in the mainland Chinese city... ==================Article 2================== Facilitation measures on two-way flow of high-end talents within the GBAThe Hong Kong Special Administrative Region Government and Mainland authorities have been exploring means to further facilitate the two-way flow of talents within the GBA, including “northbound” flow of non-Chinese Hong Kong residents.... https://www.info.gov.hk/gia/ ==================Article 3================== China cuts 5-year mortgage rate by record margin to aid property sectorThe People's Bank of China lowered the five-year rate to 3.95%, from 4.2%, marking the first reduction since last June... ==================Article 4================== 消息指中央同意擴大自由行來港 有議員料納入更多二三線城市現僅49個城市居民可自由行來港 部份省份無份原文網址: https://www.hk01.com/article/ English Google translate here. |
2024年2月23日星期五
Will HK fall more than SZ? 20240222


2024年2月15日星期四
Crypto - Is it too late to invest already? 20240215
As the relentless march continues (BTC crushed through the $50k resistance and closing above it yesterday), those who are not fully allocated to crypto may start having the usual FOMO (fear of missing out). We will look at the issue in a little detail in this email, and ask whether it is still not too late to chase...
Recent ETF trigger may drive price up more
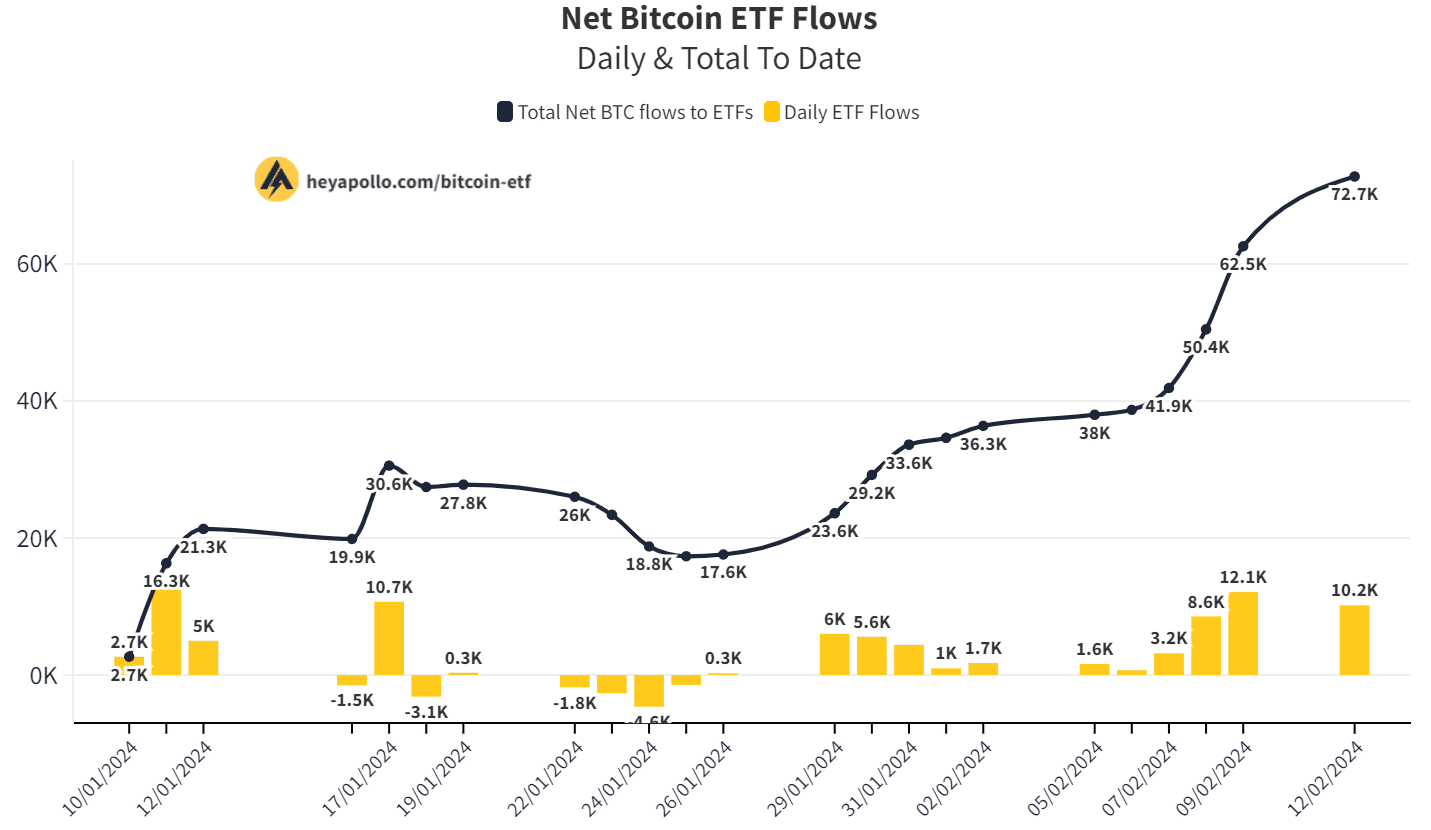
The recent spate of ETF launches did indeed have a meaningful price impact, as we already topped 70,000 BTCs bought by various funds as of 3 days ago:
Chart 1: Net Bitcoin ETF Flows |
In fact, the increasing realisation that BTC is the new gold which is not easily stopped at customs check points is probably why the BTC inflows were funded by, amongst others, gold outflows:
Chart 2: ETF Aggregate Flows Since Bitcoin Spot ETFs |

The run, however, is not just in BTC, but in the crypto complex at large - if you look at the top 15 coins (+ the 3 top stables), most were rising on the day, 7-day, and 30-day horizons, often at accelerating paces:
Table 1: Current crypto price |

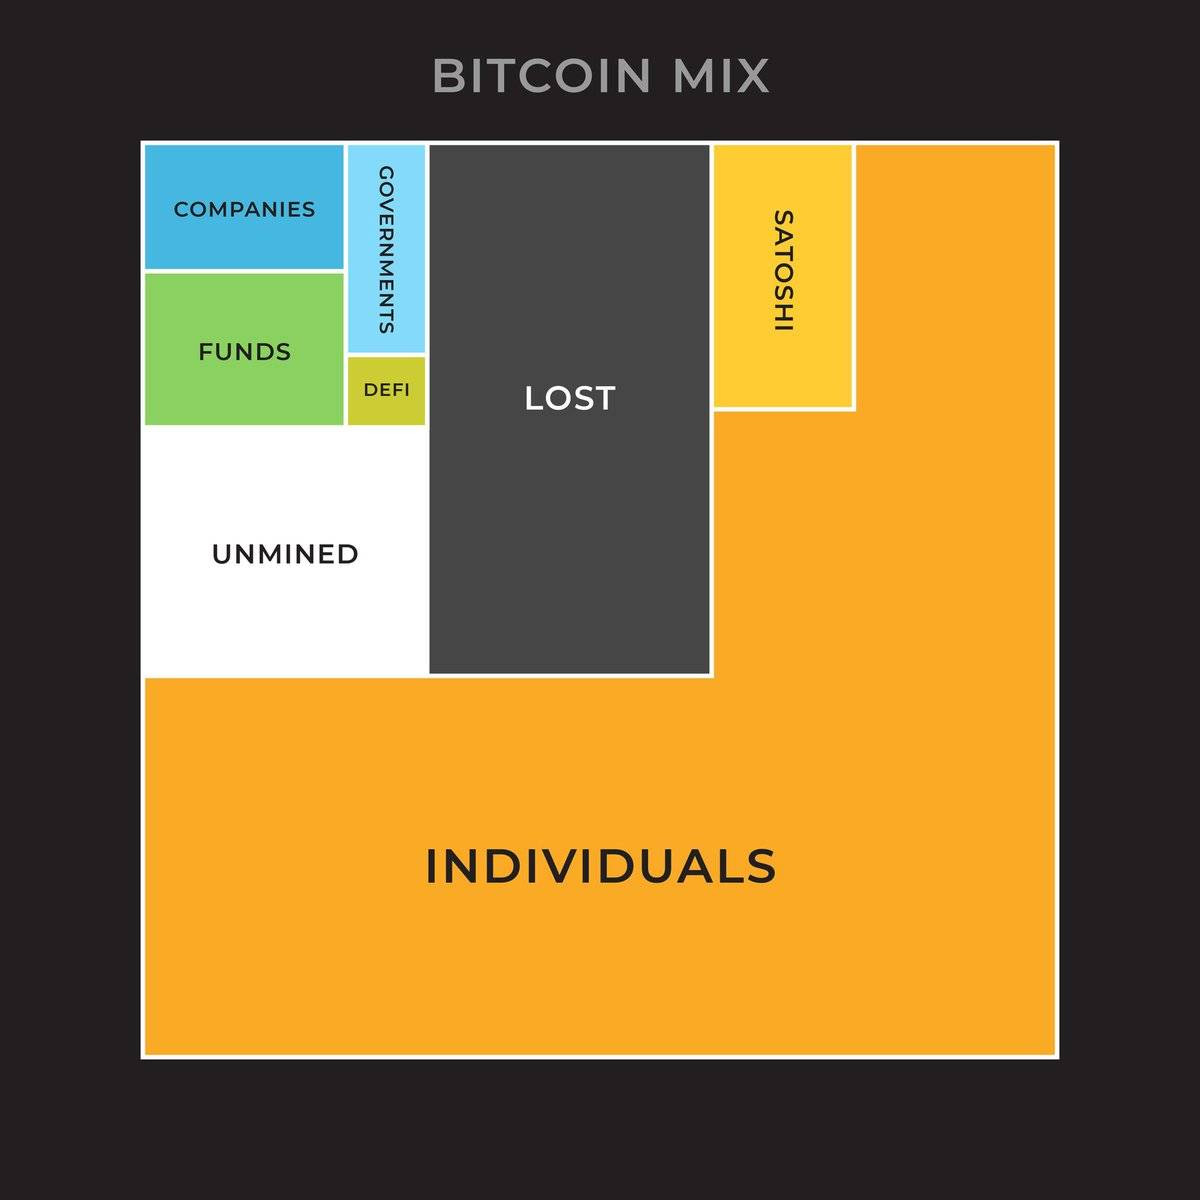
So how much is now owned by funds and how much by other entities? here is an estimate which suggests institutionalisation is only beginning, where funds ownership is just a tiny fraction (the green area most likely includes the GBTC trust already):
Figure 1: Bitcoin Mix |
Another facet of institutionalisation is how off-ramping is now finally being implemented at a large scale, as Visa the credit card company has also started taking BTC and crediting holder card account - this will finally make spending BTC a reality (not solely an investment vehicle)! More details are in article 2 below.
Is Halving as potent as touted? We think not
Some maximalists keep touting the upcoming Bitcoin halving as a trigger of a next run, but is that indeed the case? Halving describes the protocol phenomenon where after a certain number of blocks, the reward to miners (ie maintainers of the blockchain) is halved, here is a visual representation of the last 3 incidents and the upcoming one as well:
Chart 3: BTC Daily Issuance, supply, and halvings |

We believe the halving may have less to do with price rallies than the more important network effect - where more adoption increases the value of the network (of users) and thus the price of the commodity that is the subject matter of the network. In fact, as the number of coins in circulation increases and the halving reduces new supply, the proportional impact of each halving also falls, as shown in the table below - where the last halving over its 4-year period had a 8% impact on supply, but the upcoming halving sometime in mid-April will only have 4% cumulative effect:
Table 2: BTC halving |

We reckon that the more important indicator for coming price action to be on how fast the network effect spreads, which is now indeed taking off given wider institutional adoption. Our technical estimates put likely BTC prices in 3 likely levels:
a) almost there already - $60k by March 2024 (mid blue dotted line);
b) in six months' time - $190k in Aug 2024 (top red dotted line); and
c) blue sky (?) next top - $1m sometime in Q3-Q4 2025.
These are shown here:
Chart 4: BTC price log-log chart |

So perhaps you have our answer already - It is not too late to jump onboard this up cycle. In fact, just updating our usual Google search chart, you can see that the search frequency of key crypto terms remain well down from the previous two peaks in Jan 18, Apr 21 by >80%:
Chart 5: Google Search |

We would argue that another trigger to prompt more people jumping on to crypto might be govt's desperate moves to join the game through their CBDCs (central bank digital currencies) - because only by forcing people to ditch their paper notes can they flush out the money under the mattress. But what this might do instead is people sell the bank notes and buy decentralised, permissionless, and open source private coins instead...
To end, we present an updated 2-year chart of our managed strategy:
Chart 6: Core performance since 2022 |

=====================Article 1====================
The Globalists Want CBDCs in 2024… What Really Comes Next Will Surprise Them
There’s an excellent chance governments worldwide will soon force their citizens to use central bank digital currencies (CBDCs).
CBDCs enable all sorts of horrible, totalitarian things.
They allow governments to track and control every penny you earn, save, and spend. They are a powerful tool for politicians to confiscate and redistribute wealth as they see fit.
CBDCs will allow central banks to impose deeply negative interest rates, which are just a euphemism for a tax on saving money
Governments could program CBDCs to have an expiration date—like some airline frequent flyer miles—forcing people to spend them, for example, before the end of the month when they’d become worthless.
CBDCs will enable devious social engineering by allowing governments to punish and reward people in ways they previously couldn’t.
...
CBDCs are, without a doubt, an instrument of enslavement. They represent a quantum leap backward in human freedom.
...
That’s where Bitcoin comes in.
Is Bitcoin the Antidote to CBDCs?
...
CBDCs are going to introduce and familiarize people with using digital currencies. Then, it’s only a matter of time before they discover Bitcoin.
CBDCs and Bitcoin share some characteristics. For example, they are both digital and facilitate fast payments from a mobile phone. But that is where the similarities end.
The reality is that CBDCs and Bitcoin are entirely different in the most fundamental ways.
You need the government’s permission and blessing to use a CBDC. With Bitcoin, nobody can be prevented from using it.
Governments can (and will) create as many CBDC currency units as they want. Bitcoin is totally resistance to debasement. There can never be more than 21 million BTC.
CBDCs are centralized. Bitcoin is decentralized
...
In short, CBDCs are a pathetic attempt to compete with Bitcoin. They are a desperate, last-ditch effort to keep the fiat currency scam going—a Hail Mary.
CBDCs make an inferior form of money even worse, but at the same time, they are an excellent Trojan Horse for Bitcoin.
...
That’s how, contrary to conventional wisdom, CBDCs could be an enormous catalyst for Bitcoin adoption.
Historically, Bitcoin’s biggest moves to the upside happen very quickly… and the next big move could happen imminently.
...
=====================Article 2====================
Visa enables crypto withdrawals on debit cards in 145 countries
MetaMask users can now sell crypto directly to a Visa card, which eliminates the need to use centralized exchanges.
Global payment giant Visa is doubling down on cryptocurrency adoption by enabling another method to exchange crypto to fiat currencies without using a centralized exchange.
Visa has partnered with the Web3 infrastructure provider Transak to introduce cryptocurrency withdrawals and payments through the Visa Direct solution, the firms announced on Jan. 30.
The new integration allows users to withdraw cryptocurrencies like Bitcoin directly from a wallet like MetaMask to a Visa debit card. Available immediately, the integration enables one to exchange crypto to fiat and pay at 130 million merchant locations where Visa is accepted.
...
The partnership allows users from 145 countries to directly convert at least 40 cryptocurrencies to fiat without relying on centralized exchanges. Some of the supported countries include jurisdictions like Cyprus, Malta, Singapore, Turkey, Portugal and the United Arab Emirates, according to Transak's global coverage page.
...
One of the world’s largest companies in the payments industry, Visa has been actively exploring the use cases of cryptocurrency in recent years. In 2020, Visa made a major move into crypto, by partnering with the blockchain firm Circle to support the USDC stablecoin on certain Visa cards. In September 2023, Visa rolled out support for USDC payments settled on the Solana blockchain as it continued to expand the support of the stablecoin.
2023年11月28日星期二
HK Petrol Supply should be treated the same as Electricity/Gas 20231128
There is one thing that Hong Kong reigns supreme on global league tables – besides its high academic IB scores or long life expectancy – the city is the world’s most expensive place to buy petrol:
|
Figure
1: not the right reason to be named world #1?  |
So just how expensive is the cost
of petrol to the citizens living here, and is there something that should be
done about this exorbitant cost? Below we delve into the wonderful world of
high land costs, oligopolies, and misdirected net zero policies to unravel this
unfair set up that is likely hampering business and living costs for all
Hongkongers.
Disadvantaging
business vs competitors
Naturally when comparing competitiveness with other jurisdictions, we turn to fellow small open economies such as Singapore and Switzerland, while also benchmarking two larger countries for added context. In this exercise we have chosen Japan (for Asia comparison) and USA (for global context):
Chart 1: absolute petrol prices – HK is head and shoulders above rest of world…

Chart 2: we pay almost 3x as much as the average US driver

According to Bloomberg/globalpetrolprices.com
data, it is eyewatering how expensive Hong Kong’s petrol cost (U$3.09/litre in
Oct 23) is compared to Singapore which comes in at U$2/litre, while Japan sits almost
40% lower than Singapore still at $1.21/litre. But US really rules the roost,
where costs are another 12% lower at only U$1.07/litre (Chart 1). To put
everything in the context of relative premium to US prices, Singapore is
already at a high 92% premium, but Hong Kong for reasons we will look into
below, doubles that, coming at a whopping 189% premium (Chart 2) – what
is disconcerting is how the HK premium has been very steadily ranging from
150-200% since much of the past 10 years!
Petrol
overpriced against premium office rent AND per capita GDP
Is this expensive fuel cost a
function of Hong Kong’s high productivity or expensive land costs? Sadly not.
When plotted against Grade A office rents of various top financial centres, HK
really stands out in how costly its petrol is – to return to the regression
norm, the price of petrol needs to plunge some 25% as a minimum:
|
Chart
3: HK’s high petrol costs not justified even factoring in its expensive
office rents (as a cost proxy for businesses)  |
Maybe Hong Kong’s expensive real
estate is a reflection of its underlying economic productivity? So we plotted
the petrol costs against per capita GDP also – here the trend shows much
tighter clustering around the regression line:
|
Chart 4: petrol costs unjustifiably high in context of our economic output  |
Except Hong Kong that is… Being a
true outlier, our petrol prices needs to be cut an even bigger magnitude of 45%
to be near the global trend line!
A double whammy of govt & big oil plundering?
To
properly analyse the phenomenon of high prices, we first look at whether Hong
Kong is buying more expensive international oils:
|
Chart 5: Import price seems to be relatively stable compared to average Brent price (and rightfully so)  |
It seems the spread of imported petrol over Brent price has been quite stable even though the premium does vary from teens to high 30%s in the period we looked at above. As a result, Brent oil price can be a useful approximation to the cost of gasoline for imports into Hong Kong (in the absence of dedicated granular data series thereon).
Breaking out the retail prices into its key components, we can see once more how much the consumer is being disadvantaged compared to other countries – whilst the American driver pays only 42% of hiss pump cost to the oil company and government (the rest being cost of the underlying oil), Hong Kong drivers fork out 81% in the pump price to government and oil company (Chart 7), a truly exorbitant magnitude indeed:
Chart 6: Breakdown of pump price – HK is shockingly high on tax and fees

Chart 7: The same components in % terms – HK consumers pay dearly above underlying costs

But has it always been like this,
or is it something that happened recently? Looking at the past 18 years, the
government levy has not moved (despite being one of the highest in the world
all that time!), but it is the major spike in oil company profits that has
hiked costs to the consumer:
|
Chart 8: Pump price – the biggest rise were in oil company margins over the past 2 decades  |
|
Chart 9: Comparing price of
petrol filling stations; margins, and home prices  |
Not only was the arbitrary cessation of petrol
station roll out harmful to competition, as the number of cars will not stop
rising as the economy and population grows in the longer term, the wishful
thinking that everything can go from carbon based fuel to electric from now on
(which was the basis of ending new petrol station tendering) is both
unrealistic and counter-productive:
|
Chart 10: how likely can HK go from 85% carbon fuel to zero in 20 years?  |
The outright plunge by global
bureaucrats towards their utopian of zero carbon targets by 2030s will create
endless suffering to the people over whom they govern – a glance at the blue
areas above shows how overwhelmingly dominant the global economy and people’s
livelihoods are powered today by carbon sourced energy.
To impose a planned economy style
hard target over the citizenry and deprive them of essential energy (red arrow)
will surely return civilisation back to the stone ages – in other words, the
impossibility to come up with a substitute energy capacity in such a short span
of time (represented by the vertical orange arrow) means the
global population, if all following this mad course of action, will be deprived
of 85% of their current energy needs…
In view of the above, the HK govt
should rapidly reverse its policy and start issuing new petrol station sites
without delay – or consumers will continue to suffer.
A
new model for petrol station licencing?
Back to the question of affordable
fuel for the end user – the traditional way the HK government tenders out
station sites has been on a land sale mentality – that is, with a view to
selling the site areas to fetch the highest land revenue for the government and
not with a purpose of creating a sustainable after market for the masses.
However, if we view petrol as an
essential part of people’s daily needs, much like telephone and electricity
then why should we not tender petrol stations on a different formula? Whereas
the telephone exchanges and electric substations are pretty much given away for
free, we submit that petrol stations should also be tendered out based on
minimising future fuel costs.
The objective of controlling
electricity costs is achieved by the Scheme of Control framework, which is based
on return on capital invested. What we should do on petrol stations perhaps, is
to have the oil companies bid for each station where the winner of the site is
the one that promises the lowest price margins over the prevailing oil price at
the time? Not only is this simple formula easy to monitor from an ongoing
basis, it introduces a mechanism to drive down long term fuel costs and every
economic sector of the society will benefit, rather than just the government’s
one off land sale income. Which would you rather trust to keep the spoils from
reduced oil company profits – the government or the people? The answer should
be beyond dispute…
The author would like to thank Chan Hei Lui Kiandra from The University of Science and Technology majoring in Quantitative Finance for assisting in data collection and analysis of this article.
2023年11月8日星期三
A Brief History of HK’s Building Names 20231108
In a flash of curiosity, your correspondent developed an urge to look back into Hong Kong’s history through how the city has named its buildings over the past 70 years, and the handy tool with which to undertake this flight of fancy is none other than “Names of Buildings”, a regularly updated report published by the Rating and Valuations Department (RVD).
The
analysis focused on the residential and commercial buildings of the private
sector only1, covering some 12,000 structures. Since all buildings
completed before 1945 were not identified by their years of completion, we will
just put them under the “Pre1950s” group for our analysis. Also worth noting is
that since we are still early in the 2020s, this category will have much
smaller sample population than other decades:
|
Chart 1: by decade of completion, 1970s was the peak of
Hong Kong, constructions |

It is clear from above that the 1970s was the height of Hong Kong’s population growth, with 3,165 completions, followed by the 80s (3,070), just these two decades constituted around 50% of all buildings constructed in the territory.
Let’s
now delve into the wondrous world of names used to describe these thousands of
structures:
|
Chart 2, Most buildings have bilingual names, very few
were purely known in Chinese, even in the early years |
|

It is interesting to note that a substantial portion of buildings (38%) had only English names on the register in the pre-1950s era! This phenomenon receded in the subsequent decades but is now making a comeback with the 2020s now seeing 1/5 buildings with English only names again – is it increased education standards of the population, or is it more residential sale marketing gimmicks?
Below, your correspondent has generated word clouds of descriptions of building names to better visualize what dominated each era2.
Transliteration
very common in the pre-50s
The
early days of Hong Kong, it was common to have names that identified with the
property per se, with no need to call it a building or a house, such as:
Westcrag, Bethanie. The other very popular way to describe a building is use
straight Chinese transliteration of the description of the structure, where
Yuen means Garden, and Tong means Hall, while Wan means Bay, for example –
these are all prevalent names of the time:
|
Chart 3, Pre-1950s buildings – no description is good
description |

Functional
50s – all residential
After the defeat of the Nationalists in the mainland in late 1940s, there was a wave of immigrants coming to Hong Kong which drove a massive need for new residential housing to accommodate the new arrivals. This explains the dominance of residential themed building descriptions as shown here:
Chart 4, The 1950s focused mainly on residential building |

1960s saw emergence of HK’s industrial base
The continued high growth in population, coupled with the government
initiative to clear out the squatter housing by hill sides meant the 1960s continuing
the trend started a decade before – more residential buildings:
|
Chart 5, Continued dominance of the most common
descriptions in the 1960s |

But as Hong Kong started to grow and take on a manufacturing role, we started to see industrial themed descriptions come to prominence (factory) and commercial buildings related to overseas visitors (hotel) also came to the fore. In fact, the export weighting of GDP rose from 30%s in the 60s to over 50% in the next two decades, until service sector took off from the 1980s onwards:
|
Chart 6, Share of Exports reached a high in the 60s  |
Large
estates becoming common in 1970s
The most common descriptions of the last two decades continued to dominate in the 1970s – Building, Mansion, House remained the top 3 monikers, but a new trend started emerging – the popularizing of larger housing estates, as seen in the names Centre, Tower, and City during this period:
Chart 7, Most common description of building name in Hong Kong,1970s |

Godown
and Factory also rose to the top, suggesting the popularity of industrial and
import/export related buildings were increasing, and pointing to the strong
rise in HK’s manufacturing prowess in the 70s. But this decade will also be
remembered as the peak of the long reign of the term ‘Building’, when it was
used in at least 3x as many buildings as the next popular construction description:
|
Chart 8, ‘Building’ was the most popular description in
building names, during 1960-80s |

Emergence of lifestyle names in the 1980s
Perhaps due to more large estates being built, the frequency of the description ‘House’ fell in prominence in the 1980s. Also interesting, although not seen in the word cloud below is the emergence of lifestyle related words such as Chalet, Ridge, Beach, Castle, Lookout, Walk, Cliff, Grove, Cove, Monte, Summit… largely of the holiday and nature variety in their aspirations.
Chart 9, Most common description of building name in Hong Kong, 1980s |

Interesting enough, some of the transliteration type descriptions popular from the pre-1950s era were still being used, such as Yuen, Lau, Chuen, Tsuen, Tong, although the last three did no appear in the word cloud above.
Big is beautiful in the 1990s
As large estates and mega commercial complexes became the new favourite type of construction projects, coupled with big developers celebrating the peak of the property bubble in early/mid 1990s that accompanied Hong Kong’s brimming economic/cultural confidence and conspicuous consumption, it is no surprise that the term Centre became the top description in building names:
Chart 10, large estate descriptions rose in prominence in 1990s |

Other descriptions associated with large projects were also more commonly seen, such as Plaza, Square, and City. Another factor that helped the theme could be the strong last burst in population growth in the 90s, providing the needed fuel in demand as well as strong price gains:
|
Chart 11, 1990s saw the last strong burst in
immigration and thus population growth in HK |

Necessity
– the mother of all creativity in the 2000s
The
Asian Financial Crisis and the subsequent long property crash in Hong Kong
might have been the needed trigger to get developers working hard on both
quality and ingenuity in naming their products – we saw some very exciting
trends emerging in this period in how projects were named:
‘No
Description’
returns – that is, projects not ending in a description such as building or
house, but boldly go by names alone, eg. Oscar by the Sea, Noah’s Ark, Aqua
Blue, Elements;
Numbers
as descriptions,
such as SOHO 88, 99 Hennessy, One Silversea;
Definite
articles
(The/ La/ Le) everywhere, and in their own sub genres! Here are some quick
categories of interest:
·
Paradise
islands – The Capri,
The Aegean, The Giverny, and The Monet!
·
All
that glitter – The
Spectacle, The Sparkle, The Cullinan!
·
Top
of the world – The
Top, The Zenith, The Dynasty, The Centrium!
·
The
bizarre – The
Loop, The Celebrity, The Masterpiece!
· The exotic - La Maison Du Nord, Le Bleu Deux (after Le Bleu … naturally!)
|
Chart 12, the 2000s saw a burst of creativity in
building nomenclature |

Privileged
upbringing brings bold new names – the 2010s
The ‘No Description’ category
remains at the top in building names, but WHAT ON EARTH is Double Cove Starview
Prime? Other themed names that stand out include those aspiring to exclusive
new world destinations, such as: St. Moritz, St. Barts, Gramercy, Malibu. There
were even musical themed names as well: Diva, Solo, Aria, Harmony, Crescendo
(not in word cloud):
|
Chart 13: more wacky creativity in the 2010s |

Other interesting observations for the 2010s include: continued Latin invasion, such as La Splendeur, Le Prestige; and even more numbers with 2gether, K11, W668, CORE45, etc.
We surmise that these very diverse and interesting new names were perhaps brought on by a new generation of developer scions heading up their family empires, having born with silver spoons and sent to exclusive top universities for education, are full and proper integrated into the world’s best culture and lifestyles had to offer.
Short but good start to
the 2020s
We decided to add a 2020s category as well, even though we are only 3 years into the new decade. As such, trends are still emerging, but we continue to see strengthening of trends started in the 2010s: more use of numbers – such as 99 Commons, LP6; and still wackier names in the ‘No Description’ category – including Sugar+ , Sea to Sky, K-Farm, W Mega, and even OMA OMA!
Chart 14, no-description and numbers continue to be the dominant theme in 2020s so far |

Looking back, our review of the trends and fashions that shaped how Hong Kong named its buildings shows how the city’s economy constantly transformed, and how we went from small and functional to large and high density, from confident world beater to more nuanced cultural depths… surely the coming years will reveal to us what the world has in hold for us all.
1 Private
sector here means buildings excluding government subsidised flats (PRH
& HOS), government and public venues, hospitals and homes, fire and police stations,
as well as charities, religious and cultural premises.
2 Each building description includes its plural form (e.g. ‘Villa’ includes also ‘Villas’), and ‘8888’ is used to label buildings that have numbers in their names (1, 2, One etc.).
The author would like to thank Lam Chin Ming Matthew from The Chinese University of Hong Kong majoring in Quantitative Finance and Risk Management Science for assisting in data collection, analysis, and drafting of this article.