As the relentless march continues (BTC crushed through the $50k resistance and closing above it yesterday), those who are not fully allocated to crypto may start having the usual FOMO (fear of missing out). We will look at the issue in a little detail in this email, and ask whether it is still not too late to chase...
Recent ETF trigger may drive price up more
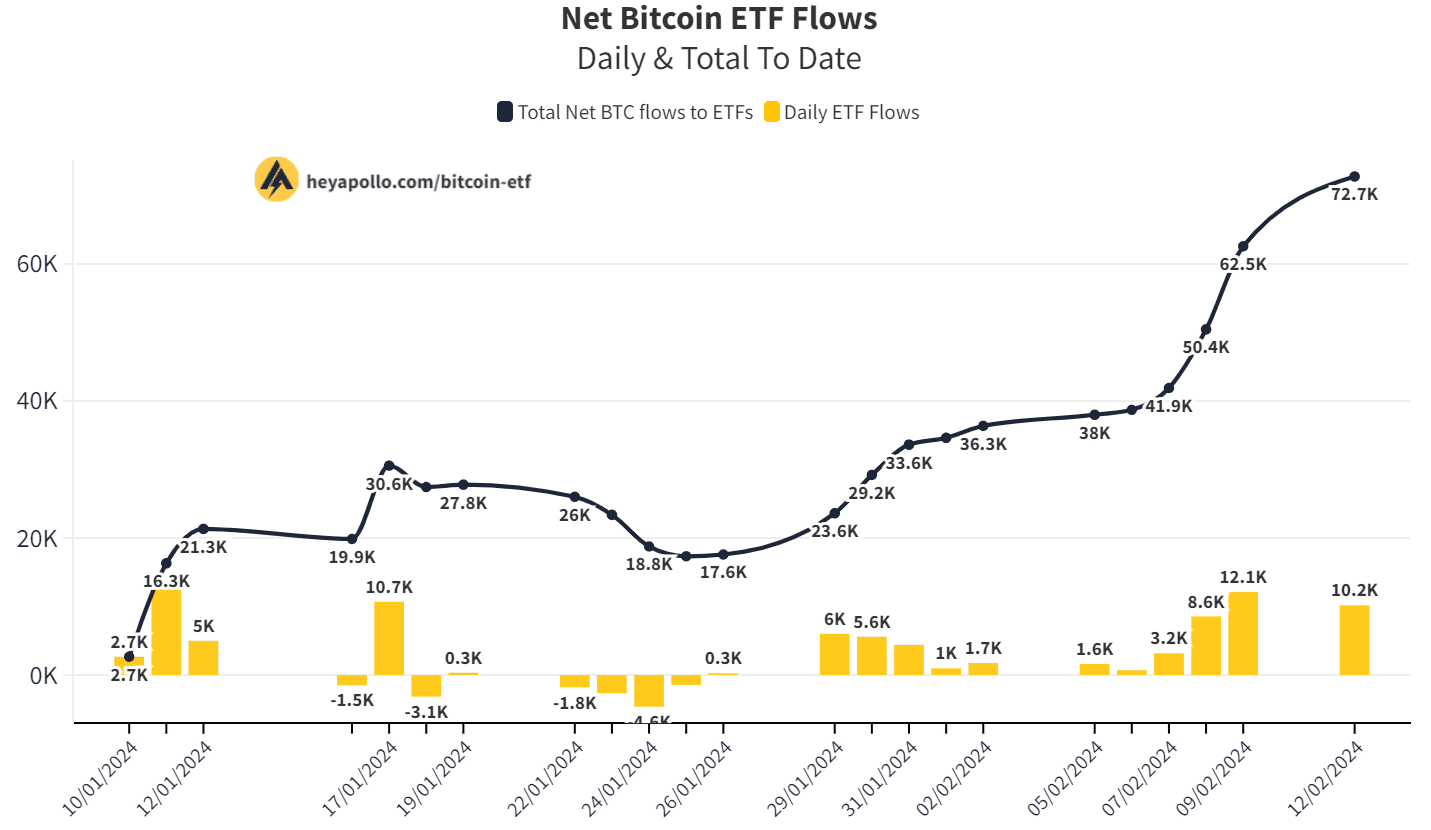
The recent spate of ETF launches did indeed have a meaningful price impact, as we already topped 70,000 BTCs bought by various funds as of 3 days ago:
Chart 1: Net Bitcoin ETF Flows |
In fact, the increasing realisation that BTC is the new gold which is not easily stopped at customs check points is probably why the BTC inflows were funded by, amongst others, gold outflows:
Chart 2: ETF Aggregate Flows Since Bitcoin Spot ETFs |

The run, however, is not just in BTC, but in the crypto complex at large - if you look at the top 15 coins (+ the 3 top stables), most were rising on the day, 7-day, and 30-day horizons, often at accelerating paces:
Table 1: Current crypto price |

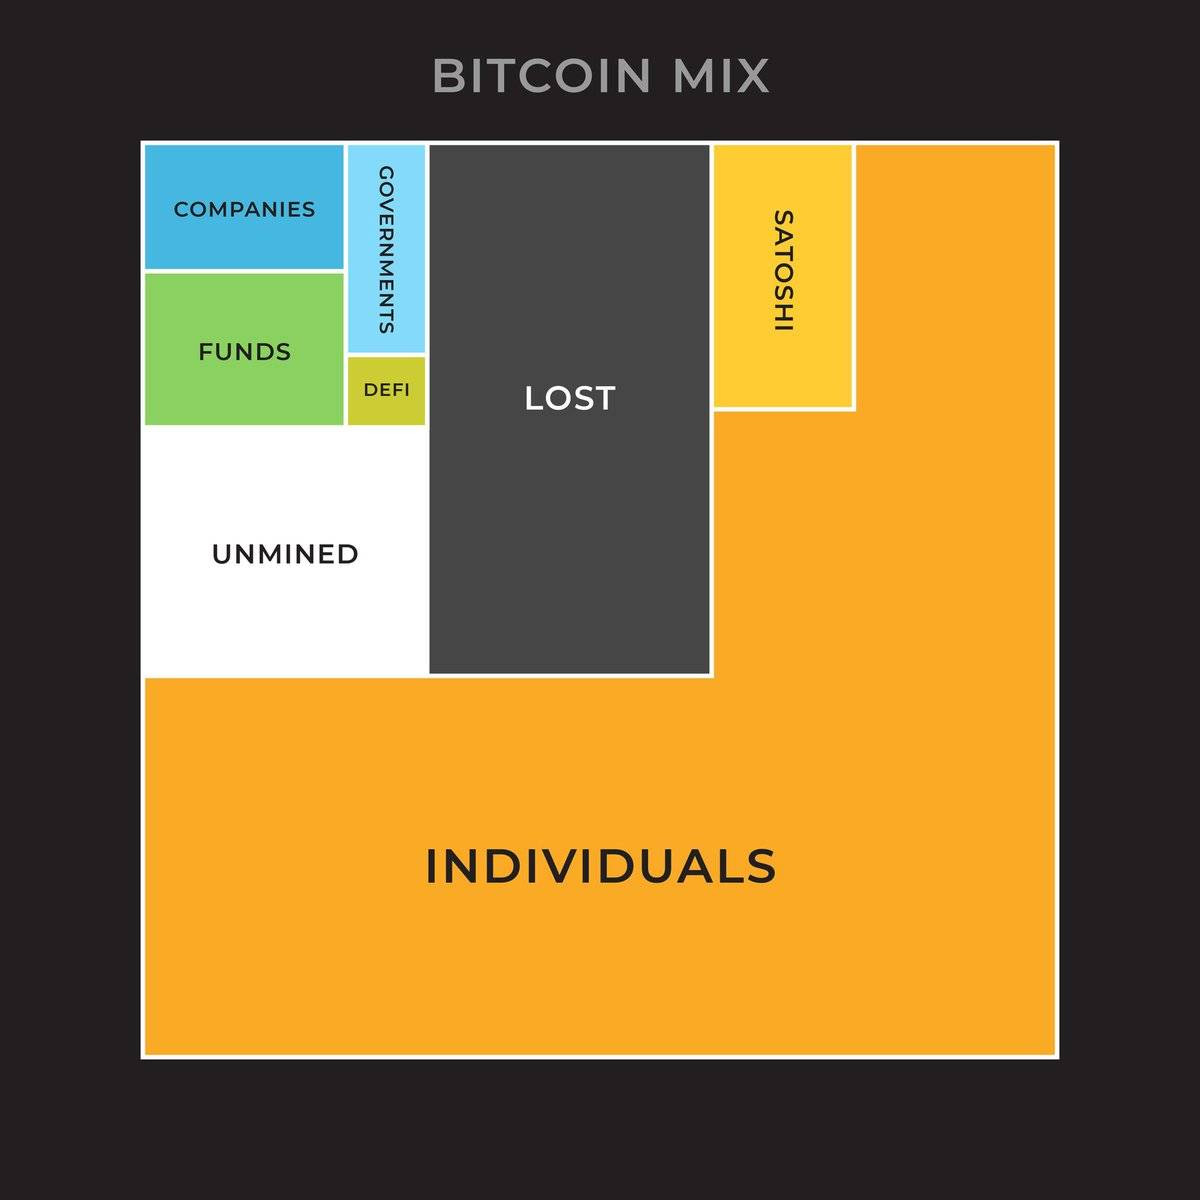
So how much is now owned by funds and how much by other entities? here is an estimate which suggests institutionalisation is only beginning, where funds ownership is just a tiny fraction (the green area most likely includes the GBTC trust already):
Figure 1: Bitcoin Mix |
Another facet of institutionalisation is how off-ramping is now finally being implemented at a large scale, as Visa the credit card company has also started taking BTC and crediting holder card account - this will finally make spending BTC a reality (not solely an investment vehicle)! More details are in article 2 below.
Is Halving as potent as touted? We think not
Some maximalists keep touting the upcoming Bitcoin halving as a trigger of a next run, but is that indeed the case? Halving describes the protocol phenomenon where after a certain number of blocks, the reward to miners (ie maintainers of the blockchain) is halved, here is a visual representation of the last 3 incidents and the upcoming one as well:
Chart 3: BTC Daily Issuance, supply, and halvings |

We believe the halving may have less to do with price rallies than the more important network effect - where more adoption increases the value of the network (of users) and thus the price of the commodity that is the subject matter of the network. In fact, as the number of coins in circulation increases and the halving reduces new supply, the proportional impact of each halving also falls, as shown in the table below - where the last halving over its 4-year period had a 8% impact on supply, but the upcoming halving sometime in mid-April will only have 4% cumulative effect:
Table 2: BTC halving |

We reckon that the more important indicator for coming price action to be on how fast the network effect spreads, which is now indeed taking off given wider institutional adoption. Our technical estimates put likely BTC prices in 3 likely levels:
a) almost there already - $60k by March 2024 (mid blue dotted line);
b) in six months' time - $190k in Aug 2024 (top red dotted line); and
c) blue sky (?) next top - $1m sometime in Q3-Q4 2025.
These are shown here:
Chart 4: BTC price log-log chart |

So perhaps you have our answer already - It is not too late to jump onboard this up cycle. In fact, just updating our usual Google search chart, you can see that the search frequency of key crypto terms remain well down from the previous two peaks in Jan 18, Apr 21 by >80%:
Chart 5: Google Search |

We would argue that another trigger to prompt more people jumping on to crypto might be govt's desperate moves to join the game through their CBDCs (central bank digital currencies) - because only by forcing people to ditch their paper notes can they flush out the money under the mattress. But what this might do instead is people sell the bank notes and buy decentralised, permissionless, and open source private coins instead...
To end, we present an updated 2-year chart of our managed strategy:
Chart 6: Core performance since 2022 |

=====================Article 1====================
The Globalists Want CBDCs in 2024… What Really Comes Next Will Surprise Them
There’s an excellent chance governments worldwide will soon force their citizens to use central bank digital currencies (CBDCs).
CBDCs enable all sorts of horrible, totalitarian things.
They allow governments to track and control every penny you earn, save, and spend. They are a powerful tool for politicians to confiscate and redistribute wealth as they see fit.
CBDCs will allow central banks to impose deeply negative interest rates, which are just a euphemism for a tax on saving money
Governments could program CBDCs to have an expiration date—like some airline frequent flyer miles—forcing people to spend them, for example, before the end of the month when they’d become worthless.
CBDCs will enable devious social engineering by allowing governments to punish and reward people in ways they previously couldn’t.
...
CBDCs are, without a doubt, an instrument of enslavement. They represent a quantum leap backward in human freedom.
...
That’s where Bitcoin comes in.
Is Bitcoin the Antidote to CBDCs?
...
CBDCs are going to introduce and familiarize people with using digital currencies. Then, it’s only a matter of time before they discover Bitcoin.
CBDCs and Bitcoin share some characteristics. For example, they are both digital and facilitate fast payments from a mobile phone. But that is where the similarities end.
The reality is that CBDCs and Bitcoin are entirely different in the most fundamental ways.
You need the government’s permission and blessing to use a CBDC. With Bitcoin, nobody can be prevented from using it.
Governments can (and will) create as many CBDC currency units as they want. Bitcoin is totally resistance to debasement. There can never be more than 21 million BTC.
CBDCs are centralized. Bitcoin is decentralized
...
In short, CBDCs are a pathetic attempt to compete with Bitcoin. They are a desperate, last-ditch effort to keep the fiat currency scam going—a Hail Mary.
CBDCs make an inferior form of money even worse, but at the same time, they are an excellent Trojan Horse for Bitcoin.
...
That’s how, contrary to conventional wisdom, CBDCs could be an enormous catalyst for Bitcoin adoption.
Historically, Bitcoin’s biggest moves to the upside happen very quickly… and the next big move could happen imminently.
...
=====================Article 2====================
Visa enables crypto withdrawals on debit cards in 145 countries
MetaMask users can now sell crypto directly to a Visa card, which eliminates the need to use centralized exchanges.
Global payment giant Visa is doubling down on cryptocurrency adoption by enabling another method to exchange crypto to fiat currencies without using a centralized exchange.
Visa has partnered with the Web3 infrastructure provider Transak to introduce cryptocurrency withdrawals and payments through the Visa Direct solution, the firms announced on Jan. 30.
The new integration allows users to withdraw cryptocurrencies like Bitcoin directly from a wallet like MetaMask to a Visa debit card. Available immediately, the integration enables one to exchange crypto to fiat and pay at 130 million merchant locations where Visa is accepted.
...
The partnership allows users from 145 countries to directly convert at least 40 cryptocurrencies to fiat without relying on centralized exchanges. Some of the supported countries include jurisdictions like Cyprus, Malta, Singapore, Turkey, Portugal and the United Arab Emirates, according to Transak's global coverage page.
...
One of the world’s largest companies in the payments industry, Visa has been actively exploring the use cases of cryptocurrency in recent years. In 2020, Visa made a major move into crypto, by partnering with the blockchain firm Circle to support the USDC stablecoin on certain Visa cards. In September 2023, Visa rolled out support for USDC payments settled on the Solana blockchain as it continued to expand the support of the stablecoin.


