顯示包含「lockdown」標籤的文章。顯示所有文章

2024年8月15日星期四

Is the F&B trade oversupplied in HK? 20240815

Lately we often hear how bad the retail scene in HK has become, and indeed a stroll down main thoroughfares around town reveals just how many boarded up vacant shops there are, even in formerly very busy precincts. So how bad has the food and beverage (F&B) landscape been? We take a look at how the numbers and make up of licences in the industry to pin down any emerging trends…

What surprises us initially is how the total number of licences have continued to increase in HK despite the severe lockdowns and the current weak economic performance – at end-2023 there were 33,536 outlets in the city, up a substantial 19% against pre-lockdown 2019:

Chart 1: No. of licences over time, and restaurant receipt changes (grey area)


Chart 2: No. of licences – Others sub category

In fact, neither the social unrest nor the lockdowns made any dent in the over army of F&B outlets in HK, whose numbers have basically increased non stop for the past quarter of a century!

Top winners have much to thank harsh lockdown policies

Because of the combined adverse events of the unrest and lockdowns, it is very appropriate to compare numbers against 2019 levels. Amongst the various categories of F&B licences, three strong winners stick out, and they are all beneficiaries of isolation/curfew/lockdown related policies that ruled the ‘covid years’:

a) Cold stores – as lockdowns and work from home (WFH) took grip, more and more people opted to take away and cook at home in the period 2020-22, resulting in a massive 41% spike in outlets that sell refrigerated foodstuffs (red bar, Chart 2);

b) Food factories – along the same vein, food factories swelled by 34% thanks to people buying more ready to serve/cook meals instead of dining in (orange bar, Chart 1);

c) Fresh provision shops – trying to eat healthy and cooking at home (as strict lockdowns prevented dining out) made this type of outlet popular, which as a result rose by 29% in the past 4 years (dark green bar, Chart 1).

Social distancing killed the sweet tooth!

The most unexpected losers in this changed dynamic was how commuters disappeared and with that bakers (presumably people bought their buns en route to work before), which were down 14% (light blue bar, Chart 1), followed by frozen confection entities, may be because there were no birthday parties or office outings, or other celebrations (purple bar, Chart 1).

Viewed in proportional terms, here is a graphic illustration of how each component of the F&B industry fared in the past few years (red arrows = expanded, blue arrows = shrank):

Chart 3: Relative weighting of F&B categories over time 

One driver of the rise in food factory category was also due to how consumers have felt poorer in the intervening years, resulting the sudden popularisation of the so called ‘Rice with Two Sides’ outlets, which mushroomed everywhere, and selling each lunchbox set for as low as $25; if you felt like pampering yourself, you might splash out and bought ‘Rice with Three Sides’ for $35!

Retail rent cannot be willed into rising despite the economy

It is easy to blame the landlords for ‘unconscionably’ high rents and coldblooded disregard for retail livelihoods, as is often heard on the media. However, just looking at how restaurant receipts have changed and how sympathetically retail rents have tracked it, one can only say that rents are very much a product of the market – if tenants can’t make money, then so can’t the landlords:

Chart 4:  Retail rent index actually underperformed restaurant receipts in the past 18 years  

In fact the total F&B receipt index is up 94% since 2005, but retail rents over the same period was up a more measly 75%...

So, if rents are not the culprit of the current F&B malaise, then what is the real problem? We hypothesise that it may be the combined effect of lack of innovation and moving up the value chain, and the southbound invasion by cheap and competitive mainland brands:

Chart 5: Retail rent index vs Restaurant receipt index  

What is clear in the chart above is that despite rising nominal receipts (red line) in the past two decades, the real income has stagnated for most of that period – with no rise at all since about 2008 (green line), then the social unrests and lockdowns became the final straw that broke the camel’s back, taking the real returns for the industry as a whole from 150 to 120 now (ie a 20% decline).

What is more alarming is how the total number of outlets continued to grow despite the savage lockdowns – the licence numbers have basically grown uninterrupted during the whole of the lockdown years (blue line). As a result, the per outlet revenue has fallen a more dramatic 30% from the mid 2018 highs to 818 now. 

Perhaps there are mix issues obscuring the numbers – for example more smaller eateries have surfaced while the industry wide capacity is reduced by larger restaurants going out of business (such as whole-floor Chinese dim sum restaurants), not to mention more licences being out of retail premises and residing in industrial properties in the form of factory kitchens. What is certain is that there is a huge amount of recovery yet to take place in HK’s F&B arena before we are genuinely ‘back in business’.

The author would like to thank Huang Ying Fung from Hong Kong University of Science and Technology majoring in Accounting and Finance for assisting in data collection, analysis, and drafting this article.


2023年7月5日星期三

How can HK alleviate the shortage in domestic helpers? 20230705

Any working couple with kids at home could recall the times when the Philippines flight bans during covid lockdowns caused a sudden shortage in helpers and pushed pay upwards of HK$8k a month for a brief period of time. In response to that symptom, the HKSAR government proposed amendments to the “Code of Practice for Employment Agencies” to reduce the ease of “job hopping” among foreign domestic helpers (FDHs).

We do not believe this rule change is the right solution (eg it infringes on freedom of labour, a fundamental human right), but take this opportunity to look at the FDH phenomenon in the context of HK’s economic set up, as well as the specific circumstances of the supply countries, hopefully identifying solutions to the shortage of staffing being reported.

Rising importance in past 30 years

HK’s economy has increasingly relied on the importation of FDH labour presumably as more and more women entered the job market, resulting in the number of FDH rising from 4.5% of total household number in 1990 to 12.7% in 2021 (blue line in Chart 1) – a 1.8x increase in proportional terms. However, obviously more singleton families are also employing FDHs (be it elderlies by themselves or unattached young professionals), this explains why FDHs as a proportion of population has increased even more over the same period from 1.2% to 4.6% now (or a 2.8x increase):

Chart 1: Number of Foreign Domestic Helper as a percentage of Hong Kong Households

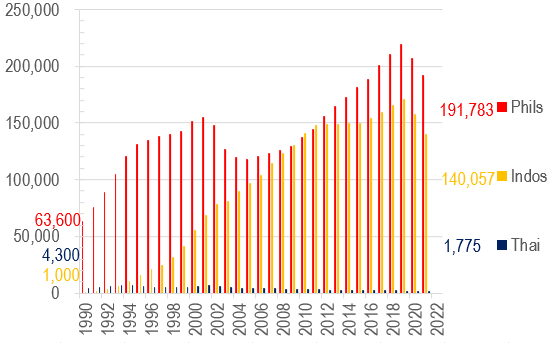
Chart 2: Number of Foreign Domestic Helpers in Hong Kong

However, this relentless increase in FDH hiring also suffered two bouts of setbacks – one after the dotcom bubble in 2001, and then another drop took place in 2020 (after the protest movement), these are marked by the dotted lines in Chart 1 above.

Within the overall trend of generally rising army of helpers, there are interesting undercurrents too – for example, against the drops in Philippines FDH in 2001-4, Indonesian reinforcements were surging that helped soften the blow. This was until the protests and lockdowns of 2019-20 drove a wholesale drop in all helper populations (Chart 2).

Cheap FDH labour helped HK’s economic wellbeing

In the 1990s when the number of FDHs surged, their impact on HK’s economy, as measured by their pay as a proportion of Hong Kong GDP, was significant – doubling from 0.4% to 0.8% overall:

Chart 3: Foreign Domestic Helper salary as a percentage of HK GDP

However, their input took a dive in the 5 years that followed 2002, dropping by 23% from the prior peak. Today the top 3 helper communities together make up only 0.645% of local GDP (Chart 3).

Changing national compositions driven by economies back home

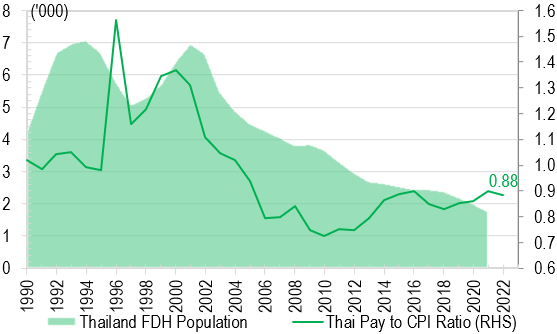
So how has HK’s attractiveness fared in the eyes of the top 3 supply countries? One thing is clear – Thai FDH supply has gone on a one way decline for pretty much the whole of the last 20 years (Chart 6) reflecting HK minimum pay underperforming Thai inflation massively since 2000. On the other hand, Phils FDH numbers have by and large increased, except during 2000-2003 when HK pay fell most against Phils inflation; and only recovered meaningfully after GFC once the pay decline has reversed once more (red line in Chart 4):

Chart 4: Philippine FDH pay relative and population of Phils in HK

Chart 5: Indonesia FDH pay relative and population of Indos in HK

Chart 6: Thai FDH pay relative and population to Thai in HK

Indo was quite different from both Thai and Phils in that despite massive pay underperformance, the absolute number of FDHs continued surging, suggesting that our minimum wage must have been rich income for the locals such that drops vs local inflation has not dented the enthusiasm with which the locals wanted to earn more income in HK (see yellow line in Chart 5).

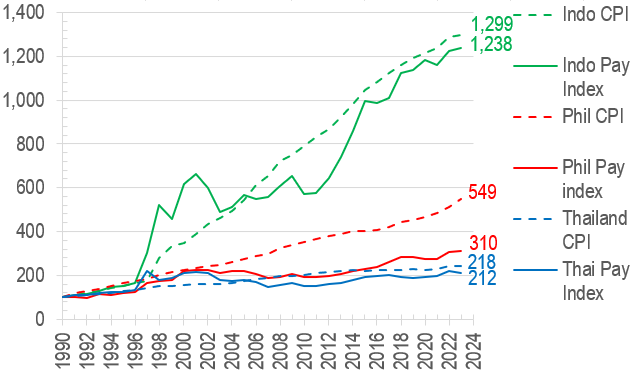
In the above charts, the ‘pay relative’ measures were arrived at using HK minimum FDH wages, translated into the local currencies back home, and divided into the local CPI, so the lines are a fair measure of how well the FDHs on minimum wages paid in HK compared to their compatriots back home. Put another way, the minimum income vs local CPI can also be expressed in separate lines, as shown here:

Chart 7: Indo/Thai pays were roughly in line with local inflation, but Phils pay significantly lost out to inflation


The above chart is also telling in that much higher Indonesian inflation over the period compared to Phils (lower by 60%) and even more vs Thai (lower by 83%) may have contributed to persistently higher FDH inflows into HK where price stability is a more important factor and USD based income considered a premium.

HKers have had it good, less so their helpers

Even so, the FDH minimum wage has still lagged behind the minimum wage levels applied to local Hongkongers (see green line in Chart 8), let alone local CPI index. In fact, from the employer’s point of view, their helpers’ wage bills have only gone up 58% over the past 33 years compared to HK inflation rising some 139% over the same period:

Chart 8: FDH minimum wage lagged the equivalent standards for locals, and both lost out to inflation in turn

The above, of course are purely based on the minimum wage measure, when there are a plethora of other administrative costs that is burdening employers on top (flight tickets, insurances, agency fees and other admin costs) which seem to proliferate constantly – perhaps on top of more equitable pay adjustments for the helpers, reform should also focus on how these new forms of administrative burden can be lessened for the hiring families?


The author would like to thank Yip Kin Long Tommy from City University of Hong Kong majoring in Accounting for assisting in data collection, analysis, and drafting this article.


2021年9月29日星期三

Is it time to buy HK retail property yet? 20210921


Stand news 20210917

In the past two years, the retail market has been decimated by first the domestic protests and then by the global lockdowns.

One of the prime victims of this combination of circumstances has been retail properties of Hong Kong, where rents have fallen some 14% from the 2019 peak, and is still down 8.9% even now (blue line in Chart 1). The drop in retail property prices were even more pronounced, down 17% peak to trough and now standing at 13% off the 2019 highs (red line in Chart 1).

Anecdotal reports of drops of 70-80% in prime street shop rents have also been common, indicating that formerly tourist hotspots have been far worse hit than the overall indices suggest.

Chart 1: Retail rents up 4x vs price surging 29x since 1984

Looking further back in time, however, both rents and prices have risen by multiples over recent decades, so the question remains – are these mere single-digit drops, which take us back to levels 7-8 years ago, enough of a correction for the current downturn?


Consumption drives rents, but interest rates hold sway of prices

To explain the rise in retail property prices, we plotted on the same chart the various components that contribute to prices: a) retail sales (very dark area, Chart 2); b) domestic consumption beyond pure retail (dark area); c) change in property yields (light area); and finally d) financing costs as represented by mortgage rates (very light area):

Chart 2: bulk of price increase driven by yield compression


Chart 3: PRC shoppers drove 03-12 run up in retail, which reversed big time after 2019


It is clear from Chart 2 that the bulk of the contribution to retail price increases were yield compression, 4.2x the magnitude contributed by domestic consumption, but yields did not follow mortgage rate’s falls which would otherwise have doubled again the net impact on retail property prices. To view the various value drivers in a logarithmic view (all exponentially rising value series are best viewed this way ), the yield compression component remains highly significant (see Chart 3).

What Chart 3 also makes clear is how retail sales as a top line driver was boosted by opening of the PRC independent travel market in 2003, which propelled retail sales to almost equal total domestic consumption by 2012. However, this factor fell away rapidly after the 2019 protests and then the lockdowns in 2020. The changed retail habits in the lockdown era also decimated retail and pushed a lot of shopping activity online, which explains the widening gap between consumption and retail in the chart.

Rental underperformance compensated by drastic yield compression

In Chart 2 above, the difference between price (red line) and the yield compression implied price (top of light area) must be explained by rental not keeping up with increases in top line consumption takes. This kind of makes sense, as not all domestic consumption activities take place in retail premises – eg services, as well as online sales, take place in office or industrial space, or increasingly nowadays, in data centres, which are calculated under office/industrial rents but not retail rents.

Another way to illustrate this divergence is shown below:

Chart 4: retail rent tracks retail sales, but not consumption

Here the rent index (purple line) tracks retail sales (blue line) very closely, proving that retail rent does indeed shadow retail specific activities and very little else – the fact they almost entirely overlap for almost all of the past three decades is impressive, and echoes our analysis above that rent has underperformed consumption (here represented by orange line) at large.


Retail property price – bit more rebound, then another leg down?

In our assessment, the current favourable tailwind of low interest rates and rental rebound from deep lockdown lows may peter out by late Q4 21 or early Q1 22, resulting in a topping out of retail property price growth by then:

Chart 5: Retail price likely to grow into end-21 before declining again as interest rates are likely to spike into 2023

Retail a safer bet than HK resi?

Despite possible bearish outcomes, retail property prices may still be in safer territory than HK residential for these reasons:

a) the lifting of lockdowns brings back PRC visitors, which will benefit foot traffic and retail rents more than residential rents;

b) the ability by PRC buyers to purchase HK flats has not evaporated as severely as retail spending in the past two years, thus will see less rebound post reopening;

c) HK’s high finance sector salaries that has sustained high residential rents may not see as much upside going forward (eg when interest rates rise and negatively impacting finance related incomes); and

d) residential yields are at historic lows and could expand even more than retail yields (blue area in Chart 6). These factors combine to provide more safety margin for retail property prices than residential prices, ie retail prices will likely outperform in the next year or two (red arrow in Chart 6):

Chart 6: Investing in retail properties seem to be a better decision than residential properties.


The ultra low yields in HK will be a big headwind to strong price appreciations ahead, especially in view of the lowest interest rates in all human history, coupled with a worldwide inflationary wave. Even so, retail property does not seem the worse amongst the various subsectors in HK property, given its recent corrections.


The author would like to thank Samson Leung of Hong Kong Baptist University and Jacky Chau of The Chinese University of Hong Kong for assisting in data collection, analysis, and drafting this article.