顯示包含「Philippines」標籤的文章。顯示所有文章

2023年7月5日星期三

How can HK alleviate the shortage in domestic helpers? 20230705

Any working couple with kids at home could recall the times when the Philippines flight bans during covid lockdowns caused a sudden shortage in helpers and pushed pay upwards of HK$8k a month for a brief period of time. In response to that symptom, the HKSAR government proposed amendments to the “Code of Practice for Employment Agencies” to reduce the ease of “job hopping” among foreign domestic helpers (FDHs).

We do not believe this rule change is the right solution (eg it infringes on freedom of labour, a fundamental human right), but take this opportunity to look at the FDH phenomenon in the context of HK’s economic set up, as well as the specific circumstances of the supply countries, hopefully identifying solutions to the shortage of staffing being reported.

Rising importance in past 30 years

HK’s economy has increasingly relied on the importation of FDH labour presumably as more and more women entered the job market, resulting in the number of FDH rising from 4.5% of total household number in 1990 to 12.7% in 2021 (blue line in Chart 1) – a 1.8x increase in proportional terms. However, obviously more singleton families are also employing FDHs (be it elderlies by themselves or unattached young professionals), this explains why FDHs as a proportion of population has increased even more over the same period from 1.2% to 4.6% now (or a 2.8x increase):

Chart 1: Number of Foreign Domestic Helper as a percentage of Hong Kong Households

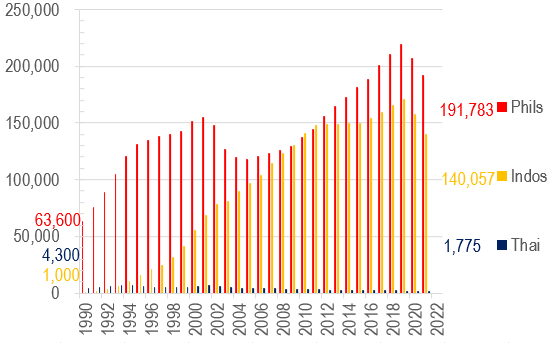
Chart 2: Number of Foreign Domestic Helpers in Hong Kong

However, this relentless increase in FDH hiring also suffered two bouts of setbacks – one after the dotcom bubble in 2001, and then another drop took place in 2020 (after the protest movement), these are marked by the dotted lines in Chart 1 above.

Within the overall trend of generally rising army of helpers, there are interesting undercurrents too – for example, against the drops in Philippines FDH in 2001-4, Indonesian reinforcements were surging that helped soften the blow. This was until the protests and lockdowns of 2019-20 drove a wholesale drop in all helper populations (Chart 2).

Cheap FDH labour helped HK’s economic wellbeing

In the 1990s when the number of FDHs surged, their impact on HK’s economy, as measured by their pay as a proportion of Hong Kong GDP, was significant – doubling from 0.4% to 0.8% overall:

Chart 3: Foreign Domestic Helper salary as a percentage of HK GDP

However, their input took a dive in the 5 years that followed 2002, dropping by 23% from the prior peak. Today the top 3 helper communities together make up only 0.645% of local GDP (Chart 3).

Changing national compositions driven by economies back home

So how has HK’s attractiveness fared in the eyes of the top 3 supply countries? One thing is clear – Thai FDH supply has gone on a one way decline for pretty much the whole of the last 20 years (Chart 6) reflecting HK minimum pay underperforming Thai inflation massively since 2000. On the other hand, Phils FDH numbers have by and large increased, except during 2000-2003 when HK pay fell most against Phils inflation; and only recovered meaningfully after GFC once the pay decline has reversed once more (red line in Chart 4):

Chart 4: Philippine FDH pay relative and population of Phils in HK

Chart 5: Indonesia FDH pay relative and population of Indos in HK

Chart 6: Thai FDH pay relative and population to Thai in HK

Indo was quite different from both Thai and Phils in that despite massive pay underperformance, the absolute number of FDHs continued surging, suggesting that our minimum wage must have been rich income for the locals such that drops vs local inflation has not dented the enthusiasm with which the locals wanted to earn more income in HK (see yellow line in Chart 5).

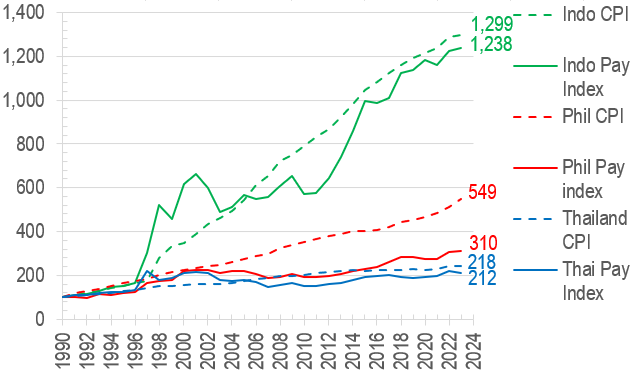
In the above charts, the ‘pay relative’ measures were arrived at using HK minimum FDH wages, translated into the local currencies back home, and divided into the local CPI, so the lines are a fair measure of how well the FDHs on minimum wages paid in HK compared to their compatriots back home. Put another way, the minimum income vs local CPI can also be expressed in separate lines, as shown here:

Chart 7: Indo/Thai pays were roughly in line with local inflation, but Phils pay significantly lost out to inflation


The above chart is also telling in that much higher Indonesian inflation over the period compared to Phils (lower by 60%) and even more vs Thai (lower by 83%) may have contributed to persistently higher FDH inflows into HK where price stability is a more important factor and USD based income considered a premium.

HKers have had it good, less so their helpers

Even so, the FDH minimum wage has still lagged behind the minimum wage levels applied to local Hongkongers (see green line in Chart 8), let alone local CPI index. In fact, from the employer’s point of view, their helpers’ wage bills have only gone up 58% over the past 33 years compared to HK inflation rising some 139% over the same period:

Chart 8: FDH minimum wage lagged the equivalent standards for locals, and both lost out to inflation in turn

The above, of course are purely based on the minimum wage measure, when there are a plethora of other administrative costs that is burdening employers on top (flight tickets, insurances, agency fees and other admin costs) which seem to proliferate constantly – perhaps on top of more equitable pay adjustments for the helpers, reform should also focus on how these new forms of administrative burden can be lessened for the hiring families?


The author would like to thank Yip Kin Long Tommy from City University of Hong Kong majoring in Accounting for assisting in data collection, analysis, and drafting this article.


2023年2月15日星期三

Cambodia investing – the next Vietnam? 20230215

After boom in property investing in Thailand, Malaysia, and more recently Vietnam, Cambodia seems also to get attention of late. As fundamentally value investors committing ahead of the crowds, we took a look at the economic fundamentals of the new destination – Cambodia has seen massive investment inflow and economic growth in the past few years, and we reckon could be a next Vietnam if the government play their moves right…

FAI – 15 years of accelerating growth to peak?

We start by looking at the fixed asset investment as a percentage of GDP – if Cambodia follows only its neighbours Vietnam (green line, Chart 1: peak FAI as % of GDP c. 35%) or Thailand (purple line: peak at 42%) then its current 26% level (magenta line) has a long way to go yet – perhaps all the new airports (9 on the drawing boards for a 17m population country!), new national highways, and high speed rails will form part of that wealth growth in the next decades:

Chart 1: Cambodia’s FAI growth has c.15 years to run before peaking (e.g. Vietnam peaked in 2010, Thailand in 1996)

Urbanisation also early days yet – huge upside almost a certainty

We were taken back by the vast amount of construction that is taking place in Cambodia in a recent research trip there – it reminds one of the buzz of property construction activities saw in China during the early 2000s. In fact the Chinese are probably THE main thrust of the current breakneck growth in both new build and regentrification construction in Cambodia.

So how does this rush to urbanisation relate to the creation of wealth for the people? We compare the past experience of fellow SEA countries to where Cambodia is now to give some context to how fast the country might grow in future years:
Chart 2: Real GDP to surge just following the footsteps of other East Asia countries

The chart above warrants some explanation:
a) as urbanisation spreads, real GDP per capita also rise, for example, urbanisation rate only reached 20% for Malaysia in the 50s (or before, earliest data from 1964 only), Thailand in the 60s, Vietnam in the 90s, and Cambodia 2010s!

b) as Cambodia's urban development gets fast tracked with Chinese expertise and capital (not enjoyed by fellow SEA peers back then), we expect a minimum milestone of 35% urbanisation rate of at least somewhere between Vietnam and Thailand (dotted blue arrow above) by 2039 and correspondingly a real per capita GDP growth of 4.8%  from 2021 to 2039;

c) however, if the current rapid speed of growth is maintained (ie same slope as the past few years – see solid blue arrow) rather than at the slower rate between Thailand/Vietnam, then a far higher level of per capita GDP might be achievable. When Cambodia reaches 35% urbanisation, a per capita GDP growth of 8.6% may be achieved in the same time... The only proviso is that this level of GDP was only reached by Thailand when it hit 52% urbanisation, and Malaysia when it reached 57%, a tall order...

In either case, we now have a good range to go by as our guide of future growth in Cambodia: 4.8-8.5% real GDP growth - per capita! This is very substantial indeed as in nominal and whole-country terms the numbers will be much higher.

Youngest populations in Asia, and almost growing the fastest
Not surprisingly given the recent history of the country, Cambodia has one of the youngest populations in Asia, at a median age of 26.5, just clipped by Philippines at 24.5:
Chart 3:Cambodia’s population is young and growing fast

The country is also growing the fastest amongst the SEA cluster, at a 1.2% p.a. growth rate. Surprisingly Thailand is now looking quite 'middle age', with median age at 39 and growth rate a meagre 0.2%... perhaps not an investment destination for high growth anymore?

Retail consumption also growing fast
With rising wealth, there should come rising spending. Using the GDP forecast (4.8-8.6% p.a.) we have arrived at above, it is not difficult to estimate the growth rate of retail consumption as well:
Chart 4:Cambodia’s domestic consumption likely track GDP growth 

Given how consistent the GDP-consumption relationship holds in other jurisdictions, we should see Cambodia's real consumption rise by a similar magnitude of 4.6-8.2% per annum in the next 18 years as shown by the vertical orange arrows in Chart 4. For retail property investment, we should consider the additional compounding effect due to urbanisation, which will concentrate more of that same spending power in city areas. Even though many big developers are building mega malls which rival some of the monsters seen in developed markets, well located future Orchard Roads (SGP) / Nathan Roads (HK) of Phnom Penh will be sure to emerge – for the savvy investor the returns will be truly significant.

As a true representation of the property market at large, one cannot avoid looking at how home prices have tracked, sadly there are only 2 years worth of data for us to look at. Interestingly it seems the turn south for Phnom Penh prices (red line) could be a result of oversupply compared to rest of the country which is less over built, and thus continuing to rise to new highs:
Chart 5:PP’s Residential price seeing a correction – perhaps a good time to research and wait for a next cycle trough…

In summary, the macro tailwinds are very strong indeed, but micro supply issues will make stock picking most crucial for successful property investing. On top of these, this country also poses additional challenges of ownership structuring (e.g. ground floors still off limits to foreigners except with nominees or trust arrangements) and politics remain a subject in need of detailed study.