顯示包含「foreign exchange」標籤的文章。顯示所有文章

2024年5月29日星期三

Is the big rush into Japanese property justified? 20240529

We have heard nothing other than 'we are buying Niseko ski flat' or 'our fund is adding Tokyo hotel' for the past few months, as if the rest of the world is all in the dog house...

Clients familiar with our arguments will know we have been negative for at least 2 years on the Japanese market, so this email seeks to give a more rounded exposition on why.

When crowds scramble one way, we go the other

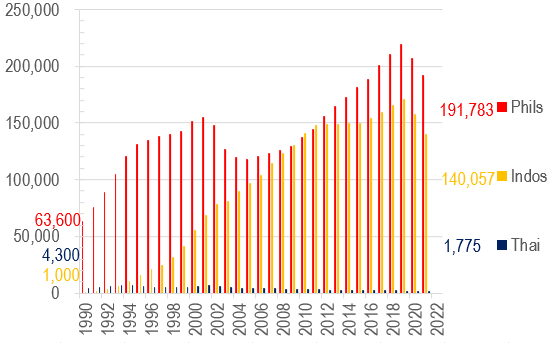
The recent scramble for adding Japanese exposure (see Article 1) is in line with the concurrent rise in the Topix, but in property land there is even more momentum, especially amongst funds:


Granted, funds have been sitting on their hands in the past 2 years as interest rates globally spiked, and their IRR calculations were thrown into disarray. So the wishful hope that Fed rate cuts will be implemented (now proven wrong), plus a reversal of Japanese asset depreciation has sparked a sudden fad into pumping money into the land of the rising (may be now setting) sun...

We are very wary of the much more significant risk of Yen devaluation against whatever puny asset appreciation in the currency in the coming years however, and would prefer other jurisdictions where BOTH currency and asset prices will rise (regular readers will know where that is!).


FX should be central in investment decisions

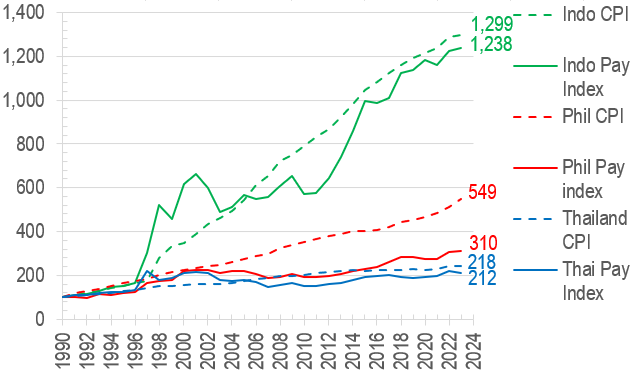
The point of making price gains but adding translation losses is best illustrated with a view to history:


As shown above, during the haydays of Japanese industrial and cultural ascent, both asset prices in local currency (LC) and exchange rates were on the rise - see left green arrow. The combined effect for foreign investors is even stronger returns in USD terms (red line) than locals (blue line), shown by the purple enlarging triangle.

In the subsequent lost 2 decades, Yen basically went sideways (2nd green arrow), with price drops very comparable in LC and USD (purple parallelogram).

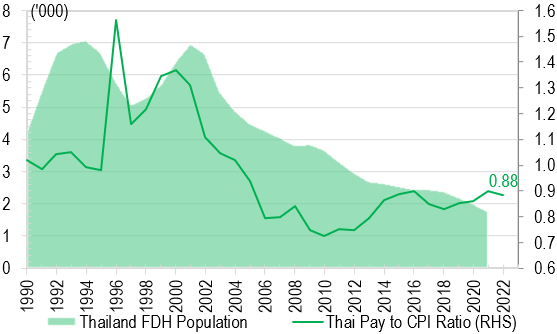
We are now probably into the next leg of Yen derating (see 3rd green arrow) thanks to shrinking population - see Article 3 - and the resurgent commodities complex when all input materials see price spirals. Unsurprisingly, since 2010, despite LC price gains, USD denominated values fell (purple trapezium).

We expect the next (final) down leg in Yen (4th green arrow) to unfold in the next 3 years or so, which can also destroy value for overseas investors (ie down red arrow despite up blue arrow).

To put it in numbers terms, below is a table showing the impact of Yen weakness (red shades) vs USD denominated Tokyo home prices:

Of course, the 2025-29 projections above are purely based on the arrows in chart above and may not play out the way we projected, but the risk that you get negative USD returns (2nd column from right) is very real indeed.


Macro picture for Japan: far from rosy

By the combined will to reintroduce inflation and to inflate away the mountains of govt debt (highest in OECD), the Japanese work force has been earning negative real income for the past two years:

In the meantime, the cost of living crisis left private consumption down for 4 quarters in a row, with little help to exports (net exports were increasingly negative in recent quarters) to contribute to GDP growth:


In the meantime, the geopolitical tensions between China and US is causing the rate environment to surge further, due to:

1) loss of demand for US debts by big traditional owners like China (fr 8.9% to 2.2% in 13 yrs) and HK, in fact Japan has also been falling in total proportion of US treasury holdings (fr 9.5% to 3.4% now):


2) Ukraine/Middle East conflicts likely to trigger more input price inflation, eg oil prices - and as a resource poor but manufacturing intensive economy, higher oil prices (blue line, down is higher prices) will tend to trigger economic contractions (red area). The green line is merely projecting prices returning to $150/barrel, which can easily be exceeded should international wars flare up again:


The result would be grim for Japanese economy. If wars spread to the APAC region, there is an added strong chance of capital flight from Japan given its recent militarisation movements might scare foreign investors away:


3) bond rout will impact Japan more than US - as US fiscal profligacy continues (yes, by adding $3.5tr debt in one year), long bond yields have nowhere to go but up (orange line), this will drag JGBs up with it (green line). Assuming totally benign geopolitical/sovereign debt calm conditions, the laughable 0.87% JGB yield will still nearly triple to 2.5%, and this 'benign' expansion of US-JP yield spread may trigger further capital outflows as money seeks higher returns in the US:


The result? Yen could drop another 25% to the 200 mark.

If this Yen drop becomes disorderly, it could result in JGBs trading at premium to TBs, leading to the much more nightmarish outcome of 10.5% JGBs vs say 8.5% TBs:


Such an outcome would mean Yen has to return to 270+ levels, much against the wishful sub-150 levels the 'anchoring biased' talking heads out there could imagine... or a 45%+ drop from current levels.


Real yields also too low to be attractive

Back to our usual real property yield table - Sydney/Singapore/Tokyo are some of the lowest returning markets on inflation adjusted basis (3rd column from right), compared to Phnom Penh/Athens which are our preferred investment destinations:


In a bond rout outcome, both European and Japanese markets will suddenly look much worse as US becomes the safe haven, thereby helping HK/NYC (2nd column from right).

Based on these various factors, we will only touch Japan if: a) long term fixed rate borrowing can be locked in; b) Yen leverage and/or hedge are put in place. But how many even the big institutions are taking these precautionary measures? We doubt many. On this note it is interesting to demonstrate how institutions are mere humans, however smart they otherwise appear: see Article 2.


==================Article 1==================

Interest in Japanese real estate grows despite rate rise prospects

Mar 8, 2024

Institutions and family offices are backing real estate for another strong year, despite the prospect of the country’s first interest rate rise since 2007.

​https://www.asianinvestor.net/article/interest-in-japanese-real-estate-grows-despite-rate-rise-prospects/494795​


==================Article 2==================

Hidden billions in Tokyo real estate lure activist hedge funds

Apr 16, 2024

The long-concealed market value of Tokyo’s largest skyscrapers is being unveiled by activist investors.

​https://www.japantimes.co.jp/business/2024/04/16/companies/headge-funds-urge-japan-real-estate-sales/​

==================Article 3==================

Japan’s Population Declines Again: Seniors 75 and Over Top 20 Million for First Time

Apr 24, 2024

An estimate published by Japan’s Ministry of Internal Affairs and Communications shows that the total population as of October 1, 2023, was 124,352,000. This was a drop of 595,000 (0.48%) from the previous year. It is the thirteenth consecutive year that the population decreased. The population of Japanese citizens was 121,193,000, for a record year-on-year decrease of 837,000, or 0.69%.

​https://www.nippon.com/en/japan-data/h01967/

2023年7月5日星期三

How can HK alleviate the shortage in domestic helpers? 20230705

Any working couple with kids at home could recall the times when the Philippines flight bans during covid lockdowns caused a sudden shortage in helpers and pushed pay upwards of HK$8k a month for a brief period of time. In response to that symptom, the HKSAR government proposed amendments to the “Code of Practice for Employment Agencies” to reduce the ease of “job hopping” among foreign domestic helpers (FDHs).

We do not believe this rule change is the right solution (eg it infringes on freedom of labour, a fundamental human right), but take this opportunity to look at the FDH phenomenon in the context of HK’s economic set up, as well as the specific circumstances of the supply countries, hopefully identifying solutions to the shortage of staffing being reported.

Rising importance in past 30 years

HK’s economy has increasingly relied on the importation of FDH labour presumably as more and more women entered the job market, resulting in the number of FDH rising from 4.5% of total household number in 1990 to 12.7% in 2021 (blue line in Chart 1) – a 1.8x increase in proportional terms. However, obviously more singleton families are also employing FDHs (be it elderlies by themselves or unattached young professionals), this explains why FDHs as a proportion of population has increased even more over the same period from 1.2% to 4.6% now (or a 2.8x increase):

Chart 1: Number of Foreign Domestic Helper as a percentage of Hong Kong Households

Chart 2: Number of Foreign Domestic Helpers in Hong Kong

However, this relentless increase in FDH hiring also suffered two bouts of setbacks – one after the dotcom bubble in 2001, and then another drop took place in 2020 (after the protest movement), these are marked by the dotted lines in Chart 1 above.

Within the overall trend of generally rising army of helpers, there are interesting undercurrents too – for example, against the drops in Philippines FDH in 2001-4, Indonesian reinforcements were surging that helped soften the blow. This was until the protests and lockdowns of 2019-20 drove a wholesale drop in all helper populations (Chart 2).

Cheap FDH labour helped HK’s economic wellbeing

In the 1990s when the number of FDHs surged, their impact on HK’s economy, as measured by their pay as a proportion of Hong Kong GDP, was significant – doubling from 0.4% to 0.8% overall:

Chart 3: Foreign Domestic Helper salary as a percentage of HK GDP

However, their input took a dive in the 5 years that followed 2002, dropping by 23% from the prior peak. Today the top 3 helper communities together make up only 0.645% of local GDP (Chart 3).

Changing national compositions driven by economies back home

So how has HK’s attractiveness fared in the eyes of the top 3 supply countries? One thing is clear – Thai FDH supply has gone on a one way decline for pretty much the whole of the last 20 years (Chart 6) reflecting HK minimum pay underperforming Thai inflation massively since 2000. On the other hand, Phils FDH numbers have by and large increased, except during 2000-2003 when HK pay fell most against Phils inflation; and only recovered meaningfully after GFC once the pay decline has reversed once more (red line in Chart 4):

Chart 4: Philippine FDH pay relative and population of Phils in HK

Chart 5: Indonesia FDH pay relative and population of Indos in HK

Chart 6: Thai FDH pay relative and population to Thai in HK

Indo was quite different from both Thai and Phils in that despite massive pay underperformance, the absolute number of FDHs continued surging, suggesting that our minimum wage must have been rich income for the locals such that drops vs local inflation has not dented the enthusiasm with which the locals wanted to earn more income in HK (see yellow line in Chart 5).

In the above charts, the ‘pay relative’ measures were arrived at using HK minimum FDH wages, translated into the local currencies back home, and divided into the local CPI, so the lines are a fair measure of how well the FDHs on minimum wages paid in HK compared to their compatriots back home. Put another way, the minimum income vs local CPI can also be expressed in separate lines, as shown here:

Chart 7: Indo/Thai pays were roughly in line with local inflation, but Phils pay significantly lost out to inflation


The above chart is also telling in that much higher Indonesian inflation over the period compared to Phils (lower by 60%) and even more vs Thai (lower by 83%) may have contributed to persistently higher FDH inflows into HK where price stability is a more important factor and USD based income considered a premium.

HKers have had it good, less so their helpers

Even so, the FDH minimum wage has still lagged behind the minimum wage levels applied to local Hongkongers (see green line in Chart 8), let alone local CPI index. In fact, from the employer’s point of view, their helpers’ wage bills have only gone up 58% over the past 33 years compared to HK inflation rising some 139% over the same period:

Chart 8: FDH minimum wage lagged the equivalent standards for locals, and both lost out to inflation in turn

The above, of course are purely based on the minimum wage measure, when there are a plethora of other administrative costs that is burdening employers on top (flight tickets, insurances, agency fees and other admin costs) which seem to proliferate constantly – perhaps on top of more equitable pay adjustments for the helpers, reform should also focus on how these new forms of administrative burden can be lessened for the hiring families?


The author would like to thank Yip Kin Long Tommy from City University of Hong Kong majoring in Accounting for assisting in data collection, analysis, and drafting this article.


2022年10月31日星期一

Is bear market confirmed for HK? 20221031

The observation that HK housing is in a downcycle has become consensus of late, after the CCL reaches a new low last week from the triple top dating as far back as 2019 (see green line in Chart 1). Cumulatively the index is now down 12% from the Aug 2021 high:

Chart 1: Home prices denominated in various currencies

But across the world, investors will always think about returns in their own currencies, and therefore, an 'objective consensus' of a true bear market in any asset price is only formed when the bulk of observers around the world see the same down trend that the base currency investors also sees.

So in order to find out whether the HK home prices are truly in a bear market by consensus (Chart 1 does not seem to suggest that is the case), let's take a look at the index as denominated in a few main jurisdictions:

a) the collective non-USD community (as proxied by DXY);

b) the EU community (as proxied by Euro);

c) the Brits (as proxied by GBP); and

d) gold bugs (as proxied by the price of gold).

HK still in bull market to world at large

From the point of view of the developed world population (as the USD index is represented by six liquid currencies, see Chart 3), however, the drop in HKD (blue line in Chart 2) terms is not corroborated by the price as measured by DXY the USD index:

Chart 2: Home price in non-USD terms still trending up

In fact, the non-USD price index is still very much heading up, from the longer term view (green dotted lines) to medium term view (red dotted lines), to even the shorter term time horizon (blue dotted lines)! What this suggests is that for the average OECD investor, HK property is still a rising asset.


Chart 3: make up of the DXY - 6 currencies

Home prices even more bullish for Europeans

For the average person based in Euro, the upward momentum seems even stronger compared to DXY, and HK prices, thanks to the collapse in Euros in the last few months, seem to be accelerating upwards within the red channel:

Chart 4: Euro investors may see HK prices accelerating upwards

Brits also feel the upturn?

Similarly, with the recent precipitous drop in the value of the Pound, the HK home price index will appear to the average Blighty investor to be positively surging even, after HK first started pulling away from a very correlated pairing between the HKD and GBP denominated indices which pretty much shadowed each other since our data started in 1981:

Chart 5: HK prices look strong to the British Pound investor

The much weaker pound post Boris's premiership (botched Brexit plus zealous lockdowns?) ensures that the weak pound has provided a strong platform for HK assets to appear to go from strength to strength.

Gold the only currency beating HK property?

For those who believe in gold, there is good news - In Gold terms, the 1997 peak remains the unsurprised top for HK home prices, meaning that we may still be in a bear market when measured from the perspective of the precious metal:

Chart 6: Gold strong vs HK, but mini breakout underway?

Even though the price index has broken above a near term trading channel, as indicated by the red arrow in Chart 6, if war does flare up more next year, we think gold might reassert its dominance and the break up could reverse. Time will tell.

Strong currency imports deflation, which is not a bad thing now!

In normal disinflationary times such as most of the past 40+ years, being pegged to the USD is good for HK assets during times of weak USD, as Chart 7 illustrates - weakening or weak USD is generally accompanied by bouts of strong home price increases, and the reverse held true (mostly in the mid/late 90s):

Chart 7: weak USD good for home prices, and vice versa - will it be different this time?

However, could we be in a period similar to the early 70s or early 80s, when strong USD will suck liquidity away from HK and produce deflation? How does this contrast the current super high inflationary environment? Is the strong USD a blessing as it reduces the 'cost of living' crisis that would otherwise hit these shores?

A very interesting dynamic, not seen before in our brief monetary history for sure... The above study shows that, whilst we remain somewhat bearish on the outlook of the HK market, more needs to happen in the global currency markets before it is a true foregone conclusion...


The author would like to thank Lee Man Hin Carson from The University of Hong Kong majoring in Accounting and Finance for assisting in data collection, analysis, and drafting of this article.