顯示包含「inflation」標籤的文章。顯示所有文章

2025年4月11日星期五

Macro – Tariff wars: property impact (mostly HK) 20250411

The Trump style of governance by social media makes it a very effective way to play out his Art of the Deal techniques, for example, this is his announcement of the latest rules overnight, from his Truth Social post:
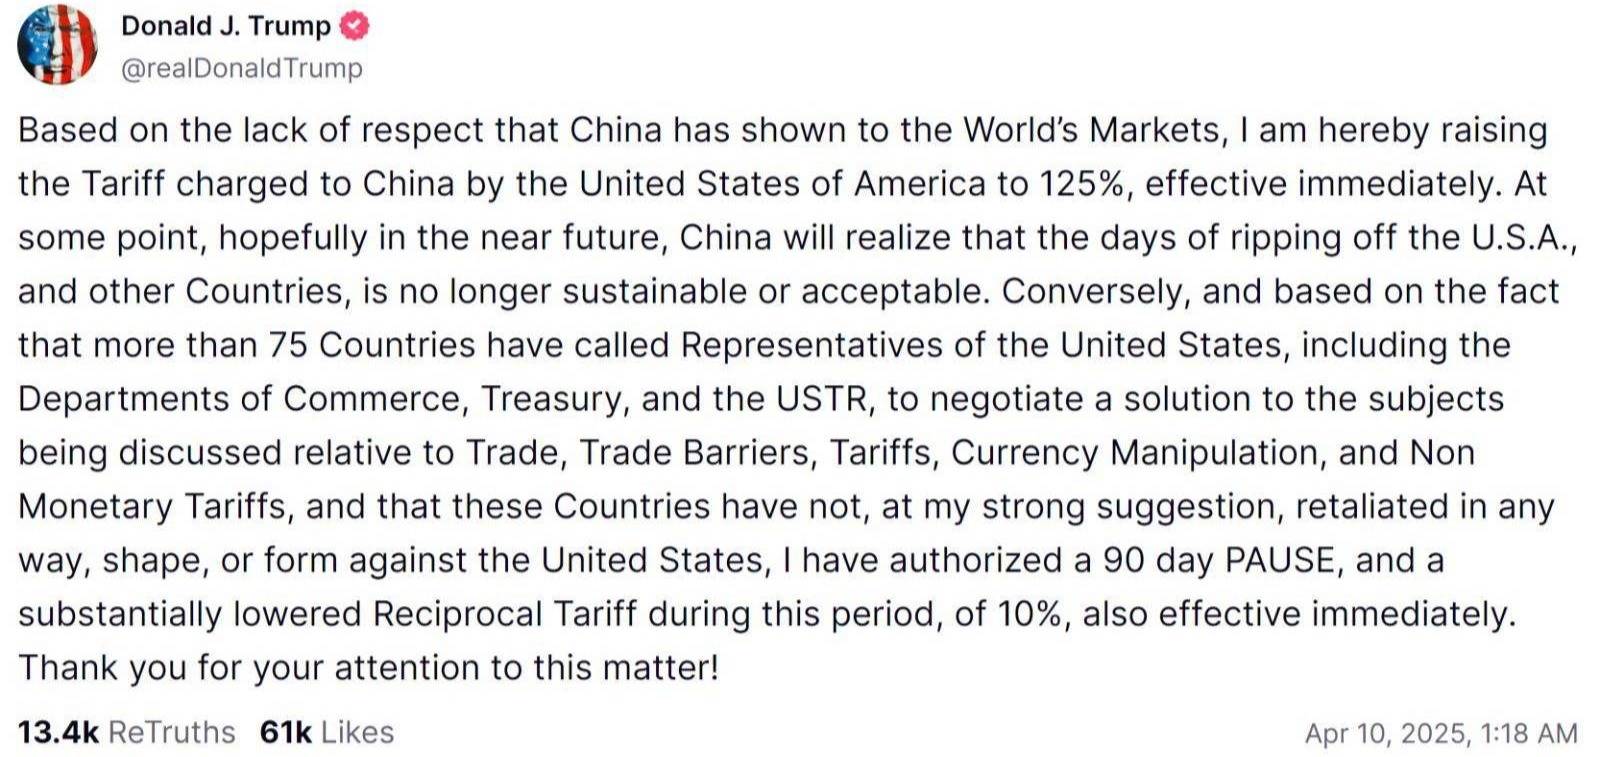


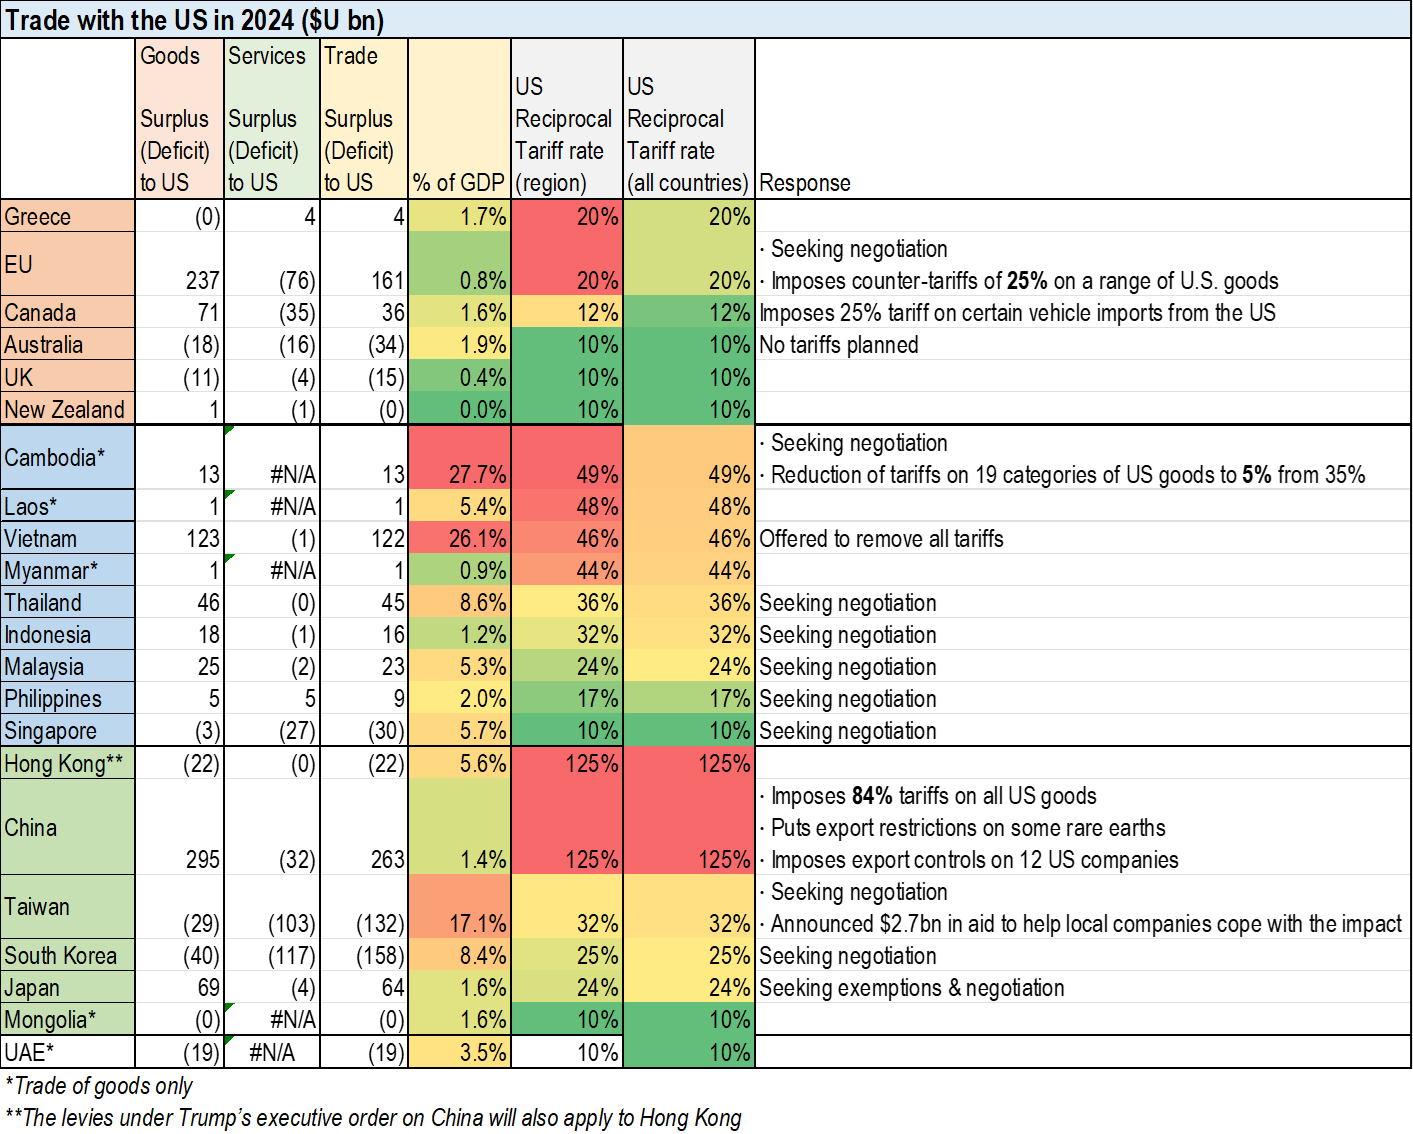
By throwing his weight around, initially with Canada and Mexico, then with EU, and now with rest of the world, it shows how powerful the US, as what I would call ‘the global consumer of last resort’, can really force agenda changes around the world, and how so many other countries buckled immediately (see updated response column):


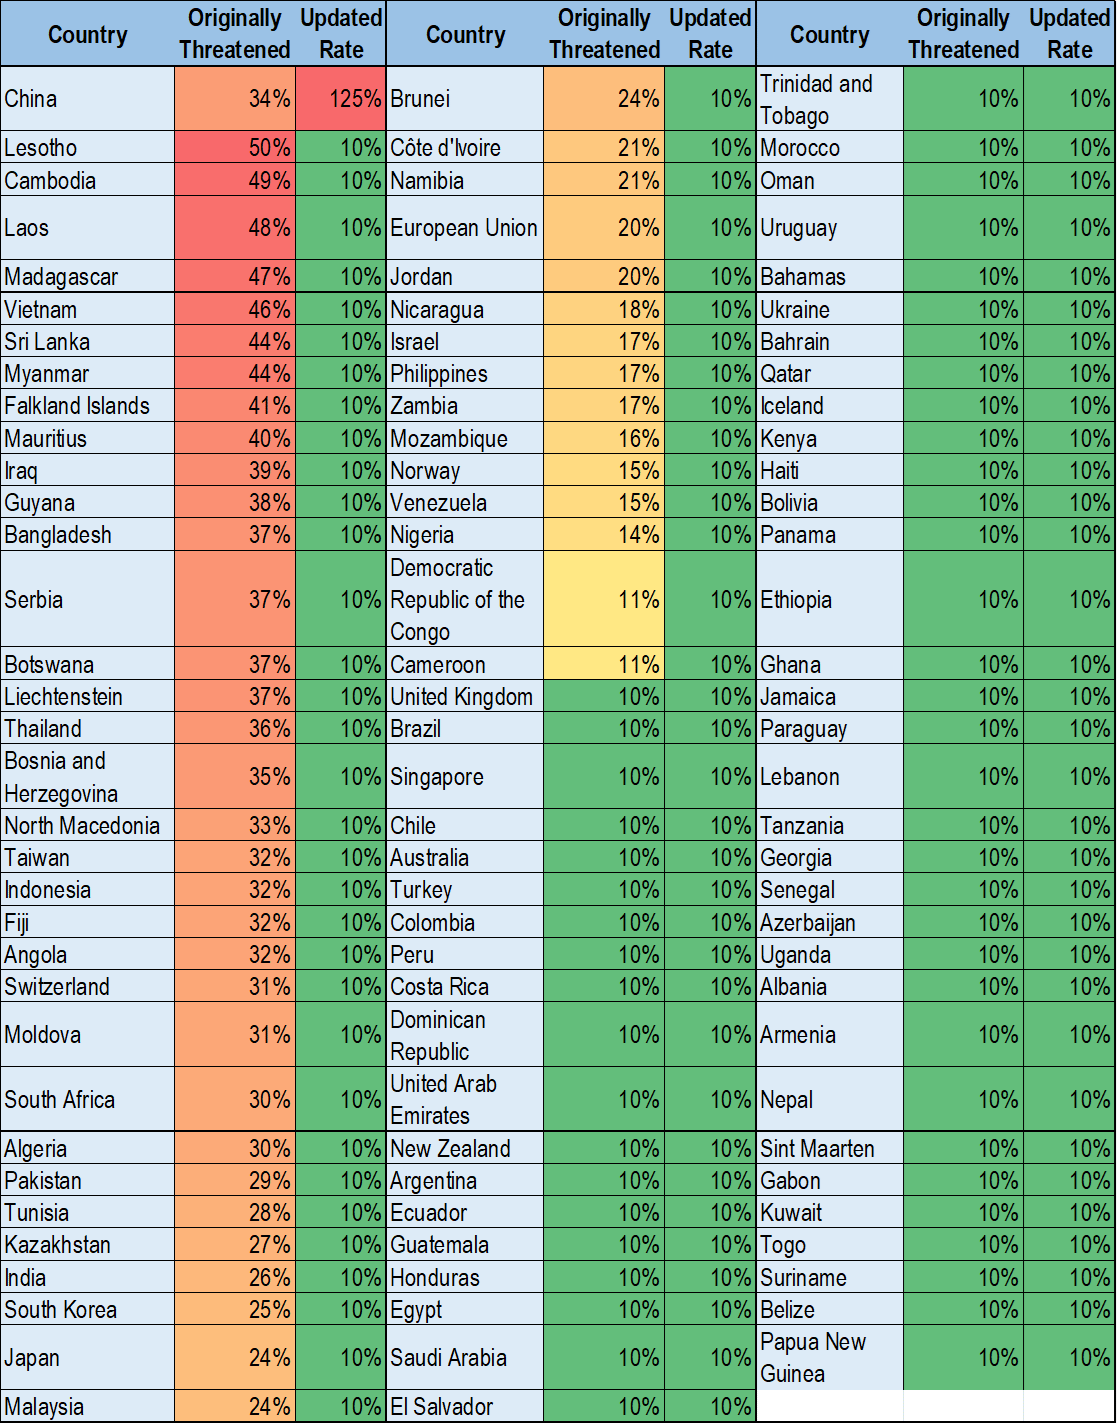
Not only is Trump quick to mount his assaults, he is equally rapid in retreating, hence today’s latest round of 90-day suspension reversal:


The violent reactions in the market is a good indicator we are in unchartered territory on this tariff issue. And the policy flipflops in the US is also contributing to the volatility.


We will chronicle the recent progress in section 1, before assessing the new geopolitical reality and how it will impact HK assets.


Fast draw, quick fire, and swift win?

Sole push-back from PRC – may still end in a deal?

The only one remaining resistance to the US tariffs is China. And what an escalation it has been (article 2, 5):


We are obviously worried this will escalate further, which will hurt everyone in the world, but are also quietly hopeful that rationality will prevail and a deal will eventually be struck. China does indeed have some powerful weapons in its arsenal, including:

a) dominant global trade position now – where it has the bulk of the international market as its partner, compared to the US, in other words, most other countries will suffer if they do not trade with China:


b) China’s large US treasuries holdings – some commentators worry about a sustained sale wreaking havoc on US’s debt and interest management:


But on closer inspection, CN’s holding of U$0.7trn of treasuries (red line above, is only 2.2% of total – red shade above), and even if they sold everything in one day, the impact would be less than 70% of the daily trade volume (black line below):


As a result we do not expect this as a meaningful lever to pull in the current trade dispute. The bigger worry should rather be how the rest of the world can keep increasing its appetite to accommodate the ever ballooning US treasury supply – now at close to $30trn a year in annual issues (bars in chart above).

c) RMB depreciation – basically for all countries facing tariff hikes, the easier route to offset (the obvious side effects of importing inflation aside), in fact, for low cost manufacturing nations, even triple digit tariffs may not result in manufacturing jobs shifting back to the USA (see article 7).

A likely outcome of the tariff war may well be the start of competitive devaluation to gain edge over other exporters. In the meantime, fast moving companies are already trying to beat the deadlines, but making dramatic moves like this:


d) escalation beyond trade – besides just tariff, both sides could get so entrenched as to start other forms of mutual sanctions, such as suggestion that US might delist PRC companies from US stock exchanges (article 6). This is where we worry most as the impact can spiral out of just trade, and hit many other sectors – eg the biggest risk to HK could be its open capital account needing access to the USD – in the most extreme case, could the HKD need to be depegged due to punitive measures from the US?

In fact smart US companies may already be plotting their exit of the HK/CN markets, and when sufficient proportions of the US corporate world have retracted (see article 4 where JP Morgan has sold its HK custody business), more severe sanctions would be much easier to be effected. Even countries are starting to view Chinese connection as a disadvantage, and siding with US in a potential geopolitical standoff (see article 1).


HK fundamentals – not too good either

Here are some factors that puts HK at risk and property prices on a downward bias:

a) Trade still too important a sector – with import/export accounting 9% of all employment in HK (light blue line), any trade spat is likely cause disproportionate amount of harm to local jobs and spending:


Total export has been seen to drive HK’s rents, and with trade falling, rents could also weaken:


b) Strong USD to depress local consumption further – it is already well aired that HK consumers are now spending weekends and holidays in cheap currency neighbours given the strong USD of the last few years. In a competitive devaluation scenario, this trend will undermine further HK’s domestic consumption – eg RMB is already down to its weakest level since 2008!

c) massive public housing supply about to hit the market – Yep, whatever the private developers hold back in supply, the govt’s usual pro-cyclical public housing policy will come to wreck the party: look at how strong the red and blue bars will surge in the next five years to take total supply in HK to the highest level since 2001:


We can only say – good luck to home buyers…

What are the possible good news from this?

This tariff episode may have its bright spots, however, such as:

– with tariff income, US can reform and abolish income tax as Trump promised;

– global markets cut domestic regulation / indirect taxes to appease the US, is structurally bullish for promoting free trade;

– China to launch massive credit easing to soften the blow => consumption spending up, trickle effect down to HK perhaps…

– HK and China both work harder to developer global South markets (article 3), opening up more diverse revenue streams in the process


=====================Article 1====================

Sino Chairman Robert Ng, Children Named Under Singapore Foreign Influence Law

2025/04/07 by Michael Cole

Singapore is set to declare one of its wealthiest property tycoons and three of his children as “politically significant persons” under a law designed to prevent foreign meddling in the country’s politics.

[…]

https://www.mingtiandi.com/real-estate/people/singapore-names-sinos-robert-ng-under-foreign-influence-act/

======================Article 2===================

China sticks to its guns as fresh US tariff threat pushes tension to the brink


BEIJING/SHANGHAI, April 8 (Reuters) – China vowed on Tuesday to “fight to the end” against U.S. tariffs as some citizens railed against President Donald Trump after he singled out Beijing for further levies, setting the stage for a standoff between the world’s two largest economies.

[…]

https://www.reuters.com/world/china-says-it-will-never-accept-us-blackmail-escalated-tariff-threats-2025-04-08/

======================Article 3===================

Hong Kong eyes Southeast Asian, Middle Eastern business ties in next chapter of belt and road plan

William Yiu 17 Feb 2024

Hong Kong will focus on business collaborations with Southeast Asian and Middle Eastern countries under the country’s belt and road plan, the head of the initiative’s local wing has said amid plans to launch a festival championing the scheme among residents.

[…]

https://www.scmp.com/news/hong-kong/hong-kong-economy/article/3252271/hong-kong-eyes-southeast-asian-middle-eastern-business-ties-next-chapter-belt-and-road-plan

======================Article 4===================

JPMorgan picks HSBC, StanChart to run $500 bln custody business in Hong Kong, Taiwan

By Selena Li March 1, 2024

HONG KONG, March 1 (Reuters) – JPMorgan Chase (JPM.N), opens new tab has selected HSBC (HSBA.L), opens new tab and Standard Chartered (STAN.L), opens new tab to operate its custody businesses in Hong Kong and Taiwan, with assets worth more than $500 billion, a spokesperson for the U.S. bank said.

[…]

https://www.reuters.com/business/finance/jpmorgan-picks-hsbc-stanchart-run-500-bln-custody-business-hong-kong-taiwan-2024-03-01/

======================Article 5===================

Beijing prepared for US tariff retaliation: Regina Ip

2025-04-08

The central government is well prepared and has a broad arsenal to respond to any further tariff escalation by US President Donald Trump, according to Executive Council convenor Regina Ip.

[…]

https://gbcode.rthk.hk/TuniS/news.rthk.hk/rthk/en/component/k2/1799392-20250408.htm

=====================Article 6====================

Delist Chinese stocks from US indices? Trump administration says ‘everything’s on the table’

9 Apr 2025

US’ Secretary of the Treasury Scott Bessent has said that “everything’s on the table” when it comes to removing Chinese companies from American stock exchanges, amid the ongoing tariff war between Washington and Beijing.

[…]

https://economictimes.indiatimes.com/news/international/global-trends/delist-chinese-stocks-from-us-indices-trump-administration-says-everythings-on-the-table/articleshow/120128240.cms?from=mdr

=====================Article 7====================

Trump’s tariff own-goal

David Webb 3 April 2025

He apparently has no idea how much this will hurt US consumers and how little it will affect the trade deficit. Asian manufacturers and their investors can, to a large extent, sleep easy tonight.


[…]

https://webb-site.com/articles/trumptariff.asp

2024年9月2日星期一

HK should resist unwarranted minimum wage encroachment

In a significant policy shift, HK’s Executive Council approved a wholesale expansion of the minimum wage regime (see here), including: 1) annual instead of biannual reviews; 2) adding economic growth on top of just inflation for basis of adjustment; 3) placing a floor on changes, ie minimum wages cannot be reduced, regardless of economic conditions. These recommendations, made by the Minimum Wage Commission, whilst well intended, will severely undermine HK’s ability as a small and open economy to adjust in a rapidly changing political/economic dynamics, and where labour as a production factor is increasingly challenged by technology and integration with China. The timing and direction both bode ill for the city’s wellbeing going forward.
Will HK fast lose its labour competitiveness vs peers?

To put the above ‘reforms’ in context, it is helpful to compare how HK’s current minimum wage numbers stack up against its global peers/competitors. Chart 1 below is ranked from high minimum wage to low order, with the highest 5 in red, the lowest 5 in blue, and the rest in green:

Chart 1:  Minimum annual wage from high to low by country

It is interesting to see that the lowest minimum wages are dominated by Asian economies – Indonesia, Vietnam, India, and Singapore (which does not have an official minimum wage, hence the bar reaches 0 on the chart). On the other hand, the highest minimum wages are found in rich and largely Anglo Saxon jurisdiction such as Switzerland, Australia, NZ, Ireland…

Look at this a different way, we arranged the countries in descending order of ‘average pay : minimum pay ratio’ and below is the outcome:

Chart 2: Ranking of ratio in average income to minimum wage

It appears that financial centre type economies dominate the high ratio end of the spectrum (top 5 in red markers), such as Singapore, US (via NYC / Chicago), HK, Luxembourg, reflecting how finance sector having a disproportionate contribution on the average income of the labour force. On the low ratio end (ie minimum wages set higher relative to average pay, blue markers), we see mostly manufacturing and farming economies, such as Poland, S Korea, NZ. It must be noted that in the above chart, Italy and Singapore do not have a formal minimum wage system, so their ratios are meaningless (so we identify their ratio with brown markers).

Represented in a two dimension way, we can see a norm emerge in the average-to-minimum pay ratio – obviously higher income countries can also afford higher minimum pay, and this explains why most of the countries follow the three dotted trend lines below:

Chart 3: higher the average pay, higher the minimum wage


Do high minimum wage lead to lower economic growth?

But how do we look at the big outliers against the trend? Obviously, the ratio as a measure of welfare is a significant factor that may impact a country’s economic performance, so we plotted this against recent growth record to reach this picture:

Chart 4: 10-year per capita GDP growth are higher in relatively lower minimum wage countries

Again, a clear trend is identifiable, but this time, the trend lines point to higher economic growth for higher average-to-minimum-wage ratios. The most extreme outliers with much higher ratios are labelled in red: Vietnam and China being the starkest examples. On the other extreme, Greece, Brazil, and Japan are lagging the most in economic growth coinciding with their respective low income ratios (blue label text).

Tax rates go up with lower welfare, reversing beyond a certain point?

We next explored how the relative level of minimum wage impacts the tax rate of its host country. The result is not so linear at all – one would expect the higher the average-to-minimum wage ratio the less the welfare burden would be, and therefore the lower the tax wedge should be. However the trend is the reverse – we see below that as the ratio increases from 1.5 towards 3 (ie from Poland towards Japan), the actual tax wedge increased:

Chart 5: Tax wedge against average-to-minimum wage ratio


The rising pattern follows the blue trend lines until we hit a much higher ratio value around 4 (ie Luxembourg levels) when a new trend emerges that starts seeing tax wedge dropping again (purple trend lines) – does this mean that if the jurisdiction is rich enough and sticks to a low minimum wage relative, it can avoid needing to raise more taxes to finance this welfare? Or are Russia, HK, Singapore unique exceptions to the rule in the high ratio zone just as Taiwan, Indonesia are in the low ratio zone?

Visible hand always causes unintended distortions

Despite having over a decade of experience with minimum wage administration, the disadvantages of putting such an important economic lever in the hands of bureaucrats is obvious:

1)     Political pressure rises during volatile asset upcycles – when home prices rise in a bubble (blue line in Chart 6, between 2012 and 2020) however fast minimum wages (red line) are adjusted up by the govt, there will be cries of stinginess, as pay simply cannot catch up with the exponential rise in home prices (thus the wage increases will still be woefully home buying needs);

2)     Private market cries foul in downcycles – although the minimum wage never catches up with private sector pays in the upcycle, note how rapidly private sector pay adjusts to economic downturns (green line in 2019-21, and no doubt 2024+) whilst the govt mandated minimum wage has only gone in one direction: forever rises, causing societal divide and cries of unfairness especially during times of economic hardship. The current proposal of not allowing the minimum wage to fall is not only redundant given past practice, but is also idiotic as it belies basic economic theories!

3)     The govt’s new proposal to benchmark minimum wage to overall GDP growth obviously incorrectly imposes the city-wide total output over what should be a per capita measure in the minimum wage situation. What this means is, if HK’s population grows fast, but overall wage rates stay stagnant, minimum wage will still be lifted irrespective of overall wage levels;

4)     Minimum wage never underperformed CPI (purple line) except briefly in 2014 – this may be why the govt has to ditch CPI as a measure, even though the disinflationary cycle is over thanks to geopolitics and deglobalization, meaning in future stagflation will result in inflation going above wage increases. How behind the curve the people residing in ivory towers could be proven again in the next few years just when the new proposals go into effect?

Chart 6: comparable benchmarks all seem to underperform minimum wages since it’s launch in 2012!


For the sharp eyed reader, the biggest surprise of the chart above is not how minimum wage has been rising too slowly, but how as of now it has risen more than all other alternative benchmarks… does this not actually annul the need for any change to increase minimum wage’s downside protection, but necessitate a more urgent need to ensure it does not detach itself from the wider economy and fairness to tax payers?

We leave you with an illustration of why this form of price control (which minimum wage is a form of) does not work – in a free economy, all types of supply and demand find equilibria wherever the two meet (Chart 7), but in a minimum wage scenario, the willing contributor to supply is banned from making that supply (dark red area in Chart 8), while all legal supply now starts above the threshold (red dotted line), but with less supply in the system, the price response is steeper as a result, with everyone in the system paying more (purple hatched area):

Chart 7: Supply demand without minimum wage

Chart 8: Supply demand under minimum wage


The problems raised by minimum wages are clear to see in recent mandates in the US where thresholds have been raised – in the situations below, either the supply is replaced by automation (the protected worker losing their jobs as a result, Figure 1) or the employer cannot afford extra pay so cutting supply instead (the workers working shorter hours instead, Figure 2):

Figure 1: automation replaces existing supply

Source: bizjournals.com

Figure 2: … or supply reduction, resulting in workers increasing input intensity? 

Source: Gary Varvel


The author would like to thank Pan Ming Yue from City University of Hong Kong majoring in Finance and Muhammad Mudassar from City University of Hong Kong majoring in Global Business for assisting in data collection, analysis, and drafting this article.

2024年5月29日星期三

Is the big rush into Japanese property justified? 20240529

We have heard nothing other than 'we are buying Niseko ski flat' or 'our fund is adding Tokyo hotel' for the past few months, as if the rest of the world is all in the dog house...

Clients familiar with our arguments will know we have been negative for at least 2 years on the Japanese market, so this email seeks to give a more rounded exposition on why.

When crowds scramble one way, we go the other

The recent scramble for adding Japanese exposure (see Article 1) is in line with the concurrent rise in the Topix, but in property land there is even more momentum, especially amongst funds:


Granted, funds have been sitting on their hands in the past 2 years as interest rates globally spiked, and their IRR calculations were thrown into disarray. So the wishful hope that Fed rate cuts will be implemented (now proven wrong), plus a reversal of Japanese asset depreciation has sparked a sudden fad into pumping money into the land of the rising (may be now setting) sun...

We are very wary of the much more significant risk of Yen devaluation against whatever puny asset appreciation in the currency in the coming years however, and would prefer other jurisdictions where BOTH currency and asset prices will rise (regular readers will know where that is!).


FX should be central in investment decisions

The point of making price gains but adding translation losses is best illustrated with a view to history:


As shown above, during the haydays of Japanese industrial and cultural ascent, both asset prices in local currency (LC) and exchange rates were on the rise - see left green arrow. The combined effect for foreign investors is even stronger returns in USD terms (red line) than locals (blue line), shown by the purple enlarging triangle.

In the subsequent lost 2 decades, Yen basically went sideways (2nd green arrow), with price drops very comparable in LC and USD (purple parallelogram).

We are now probably into the next leg of Yen derating (see 3rd green arrow) thanks to shrinking population - see Article 3 - and the resurgent commodities complex when all input materials see price spirals. Unsurprisingly, since 2010, despite LC price gains, USD denominated values fell (purple trapezium).

We expect the next (final) down leg in Yen (4th green arrow) to unfold in the next 3 years or so, which can also destroy value for overseas investors (ie down red arrow despite up blue arrow).

To put it in numbers terms, below is a table showing the impact of Yen weakness (red shades) vs USD denominated Tokyo home prices:

Of course, the 2025-29 projections above are purely based on the arrows in chart above and may not play out the way we projected, but the risk that you get negative USD returns (2nd column from right) is very real indeed.


Macro picture for Japan: far from rosy

By the combined will to reintroduce inflation and to inflate away the mountains of govt debt (highest in OECD), the Japanese work force has been earning negative real income for the past two years:

In the meantime, the cost of living crisis left private consumption down for 4 quarters in a row, with little help to exports (net exports were increasingly negative in recent quarters) to contribute to GDP growth:


In the meantime, the geopolitical tensions between China and US is causing the rate environment to surge further, due to:

1) loss of demand for US debts by big traditional owners like China (fr 8.9% to 2.2% in 13 yrs) and HK, in fact Japan has also been falling in total proportion of US treasury holdings (fr 9.5% to 3.4% now):


2) Ukraine/Middle East conflicts likely to trigger more input price inflation, eg oil prices - and as a resource poor but manufacturing intensive economy, higher oil prices (blue line, down is higher prices) will tend to trigger economic contractions (red area). The green line is merely projecting prices returning to $150/barrel, which can easily be exceeded should international wars flare up again:


The result would be grim for Japanese economy. If wars spread to the APAC region, there is an added strong chance of capital flight from Japan given its recent militarisation movements might scare foreign investors away:


3) bond rout will impact Japan more than US - as US fiscal profligacy continues (yes, by adding $3.5tr debt in one year), long bond yields have nowhere to go but up (orange line), this will drag JGBs up with it (green line). Assuming totally benign geopolitical/sovereign debt calm conditions, the laughable 0.87% JGB yield will still nearly triple to 2.5%, and this 'benign' expansion of US-JP yield spread may trigger further capital outflows as money seeks higher returns in the US:


The result? Yen could drop another 25% to the 200 mark.

If this Yen drop becomes disorderly, it could result in JGBs trading at premium to TBs, leading to the much more nightmarish outcome of 10.5% JGBs vs say 8.5% TBs:


Such an outcome would mean Yen has to return to 270+ levels, much against the wishful sub-150 levels the 'anchoring biased' talking heads out there could imagine... or a 45%+ drop from current levels.


Real yields also too low to be attractive

Back to our usual real property yield table - Sydney/Singapore/Tokyo are some of the lowest returning markets on inflation adjusted basis (3rd column from right), compared to Phnom Penh/Athens which are our preferred investment destinations:


In a bond rout outcome, both European and Japanese markets will suddenly look much worse as US becomes the safe haven, thereby helping HK/NYC (2nd column from right).

Based on these various factors, we will only touch Japan if: a) long term fixed rate borrowing can be locked in; b) Yen leverage and/or hedge are put in place. But how many even the big institutions are taking these precautionary measures? We doubt many. On this note it is interesting to demonstrate how institutions are mere humans, however smart they otherwise appear: see Article 2.


==================Article 1==================

Interest in Japanese real estate grows despite rate rise prospects

Mar 8, 2024

Institutions and family offices are backing real estate for another strong year, despite the prospect of the country’s first interest rate rise since 2007.

​https://www.asianinvestor.net/article/interest-in-japanese-real-estate-grows-despite-rate-rise-prospects/494795​


==================Article 2==================

Hidden billions in Tokyo real estate lure activist hedge funds

Apr 16, 2024

The long-concealed market value of Tokyo’s largest skyscrapers is being unveiled by activist investors.

​https://www.japantimes.co.jp/business/2024/04/16/companies/headge-funds-urge-japan-real-estate-sales/​

==================Article 3==================

Japan’s Population Declines Again: Seniors 75 and Over Top 20 Million for First Time

Apr 24, 2024

An estimate published by Japan’s Ministry of Internal Affairs and Communications shows that the total population as of October 1, 2023, was 124,352,000. This was a drop of 595,000 (0.48%) from the previous year. It is the thirteenth consecutive year that the population decreased. The population of Japanese citizens was 121,193,000, for a record year-on-year decrease of 837,000, or 0.69%.

​https://www.nippon.com/en/japan-data/h01967/

2024年2月23日星期五

Will HK fall more than SZ? 20240222

HK property is facing significant challenges, in the new reality of being increasingly viewed as 'another Chinese' city. Will this mean prices will fall more than its brethren in the north (or rise less if market turns up) henceforth?

We look into a number of factors that influence the outcome of this interesting investment dynamic, perhaps starting with the bad news first:

1) Chinese outbound tourists bypassing HK (bad)?

As more relaxations are introduced/restored for visa free entry to global destinations (right column in table below), PRC tourists may bypass HK even more and head for exotic climes directly:


This trend of disintermediation, is also manifesting with more overseas countries given visa exemptions for visiting China (left column above), a factor further compounded by increasing flights from gateway PRC airports to overseas cities, reducing the hub role HK has long come to enjoy.

2) Rising retail standard + cheap RMB => surging northbound HK shoppers (bad)

As amply illustrated in article 1 below, increasingly sophisticated retail offerings in PRC cities, more spacious physical hardware, (sometimes) better services, and of course cheaper cost is now triggering a new phenomenon where HKers go spend weekends in SZ for leisure and even for grocery shopping.

In office space alone, more companies may be tempted by the now Grade A spec but much more affordable occupation costs up north:

Global Occupier Markets: Prime Office Costs – Q4 2023

HK office costs are still 3x prime SZ equivalents, which coupled with cheaper labour, may entice increasing numbers of businesses to set up north of the border - especially if travelling on the High Speed Rail, one can be in Futian from Kowloon West in a matter of 14 minutes, on fares (book yours here) cheaper than the cost of a cup of Starbucks ...

It is worth noting also that occupancy costs fell across the board in the China/HK markets in Q4 23, compared to mostly rises in other global cities - showing how weak the domestic economy was then, and why the Chinese govt had to pump prime to save the property sector in recent weeks.

3) PRC rate cuts vs Fed rate hikes (bad)

We have long maintained that wars and deglobalisation will only worsen inflationary pressures, and that this would leave little to no scope for rate cuts by the Fed:


On the other hand, the need to reflate domestic consumption is leading China to stage one rate cut after another (article 3):
LPR = loan prime rate

What's more, the still high real interest rates in China allows it ample further scope for credit easing - some 150bps vs US, and nearly 280bps vs UK):

The conclusion of this rate trend divergence is best illustrated in the chart below:

Whenever HK rates hike less than PRC rates (green arrows pointing up, eg 1992, 2006), HK prices tend to rise much faster (red arrows up). The reverse is the case when HK rates rises more above PRC rates - which is where we are now - prices underperform SZ (eg 1996, 2013 to date).

With the rate picture increasingly looking like HK rates staying high while China cuts further in the coming year (rightmost green arrow above), HK residential premium over SZ will likely shrink further in the coming two years.

4) Facilitating Southbound flows (good)

The HK govt has been tapping into the rise in PRC wealth and talent by attracting them to settle in HK (article 2), but this is not radically different from some other immigration schemes already in place, and perhaps does not have as strong an impact as in earlier years.

Similarly, attracting more southbound shoppers is nearing its potential (we already have 49 cities on easy travel arrangements, see article 4), and thus will unlikely result in any quantum leaps with further relaxations.

5) Higher SZ base good for higher HK too (good)

As can be seen below, the premium in HK prices remain quite substantial over SZ for comparable luxury estates (Residence Bel Air in HK vs Seaworld Shuangxi Garden in SZ):


Whilst global comparison suggest that our current 120% premium may be too high - eg NYC Midtown is 50% premium over San Fran, and 63% premium over NYC Downtown - perhaps the shrinkage of the HK-SZ premium is largely done. Hopefully SZ price increases will do most of the catch up work rather than even deeper HK price drops...

Looking forward, we think a combination of the two remains the most likely scenario; here the Price-to-income ratio trends suggest that SZ prices will improve by some 12% in the coming year or two whilst HK might see a larger 30% correction. For HK, the bulk of the improvement will have to come in price correction rather than income growth:


6) Yields already safer than many global cities (good)

A saving grace for HK at least is that its real property yield is already quite 'reasonable' when viewed in the context of real property returns:


Above table is updated to December, showing that high inflationary pressures in places like Tokyo and London is destroying returns on rentals, whilst both SZ and HK sit reasonably happy in positive territory near the top of the pile. Generally high real return markets are more sustainable pricewise than -ve yielding ones.

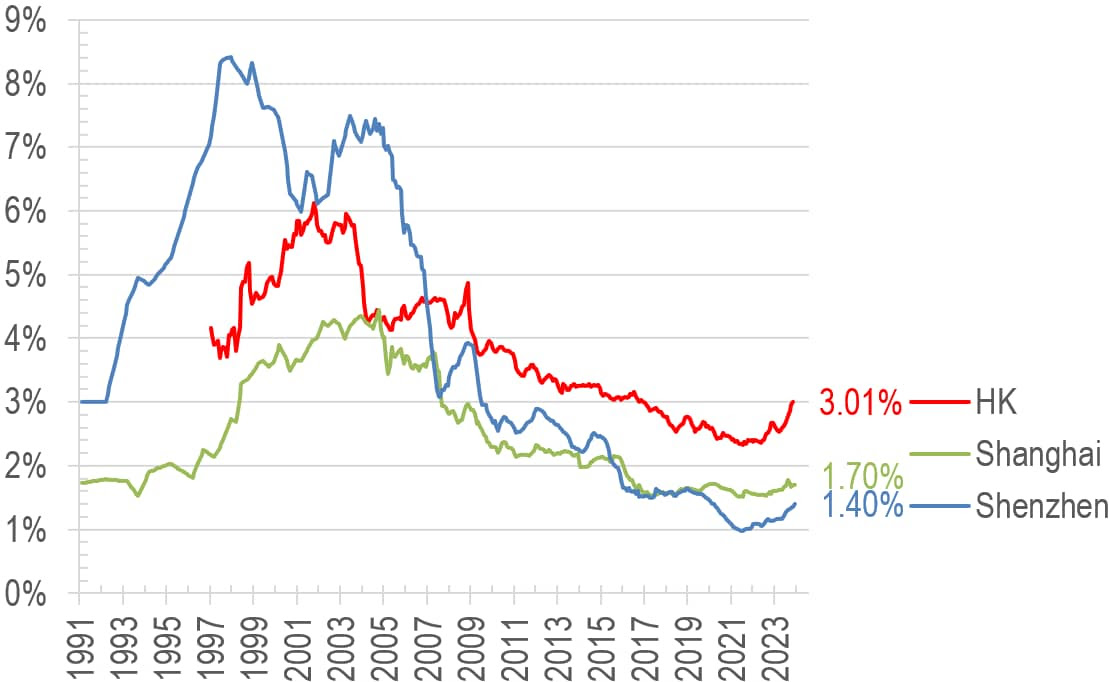
The higher nominal yield in HK (3%) also means that the higher interest rates here in the longer term will make for a healthier market when SZ's paltry 1.4%:

rental yield

7) final technical look - SZ might do better medium term?

On a long term technical perspective, SZ could continue to play catch up, but we await price action to give the next signal (either pierces the green support or breaks out of the blue resistance) before jumping into investment action. The answer might show itself by as early as mid-2024:

SZ vs HK price ratios

Given various headwinds in primarily geopolitics, perhaps investors are best to diversify into commodities and low conflict risk jurisdictions, exactly what we have been doing for the past 2-3 years...


==================Article 1==================

Hong Kong vs Shenzhen: a day of food, drinks, sightseeing and leisure compared – how much cheaper can the mainland Chinese city be?

The recent jump in people heading from Hong Kong to Shenzhen at the weekend suggests you can enjoy a lot more for much less in the mainland Chinese city...

https://www.scmp.com/lifestyle/travel-leisure/article/3250410/hong-kong-vs-shenzhen-day-food-drinks-sightseeing-and-leisure-compared-how-much-cheaper-can-mainland

==================Article 2==================

Facilitation measures on two-way flow of high-end talents within the GBA

The Hong Kong Special Administrative Region Government and Mainland authorities have been exploring means to further facilitate the two-way flow of talents within the GBA, including “northbound” flow of non-Chinese Hong Kong residents....

https://www.info.gov.hk/gia/general/202401/24/P2024012400464.htm

==================Article 3==================

China cuts 5-year mortgage rate by record margin to aid property sector

The People's Bank of China lowered the five-year rate to 3.95%, from 4.2%, marking the first reduction since last June...

https://asia.nikkei.com/Economy/China-cuts-5-year-mortgage-rate-by-record-margin-to-aid-property-sector

==================Article 4==================

消息指中央同意擴大自由行來港 有議員料納入更多二三線城市

現僅49個城市居民可自由行來港 部份省份無份

原文網址:

https://www.hk01.com/article/993035

English Google translate here.

2023年7月5日星期三

How can HK alleviate the shortage in domestic helpers? 20230705

Any working couple with kids at home could recall the times when the Philippines flight bans during covid lockdowns caused a sudden shortage in helpers and pushed pay upwards of HK$8k a month for a brief period of time. In response to that symptom, the HKSAR government proposed amendments to the “Code of Practice for Employment Agencies” to reduce the ease of “job hopping” among foreign domestic helpers (FDHs).

We do not believe this rule change is the right solution (eg it infringes on freedom of labour, a fundamental human right), but take this opportunity to look at the FDH phenomenon in the context of HK’s economic set up, as well as the specific circumstances of the supply countries, hopefully identifying solutions to the shortage of staffing being reported.

Rising importance in past 30 years

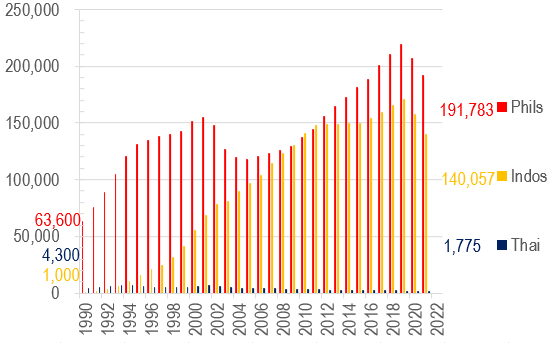
HK’s economy has increasingly relied on the importation of FDH labour presumably as more and more women entered the job market, resulting in the number of FDH rising from 4.5% of total household number in 1990 to 12.7% in 2021 (blue line in Chart 1) – a 1.8x increase in proportional terms. However, obviously more singleton families are also employing FDHs (be it elderlies by themselves or unattached young professionals), this explains why FDHs as a proportion of population has increased even more over the same period from 1.2% to 4.6% now (or a 2.8x increase):

Chart 1: Number of Foreign Domestic Helper as a percentage of Hong Kong Households

Chart 2: Number of Foreign Domestic Helpers in Hong Kong

However, this relentless increase in FDH hiring also suffered two bouts of setbacks – one after the dotcom bubble in 2001, and then another drop took place in 2020 (after the protest movement), these are marked by the dotted lines in Chart 1 above.

Within the overall trend of generally rising army of helpers, there are interesting undercurrents too – for example, against the drops in Philippines FDH in 2001-4, Indonesian reinforcements were surging that helped soften the blow. This was until the protests and lockdowns of 2019-20 drove a wholesale drop in all helper populations (Chart 2).

Cheap FDH labour helped HK’s economic wellbeing

In the 1990s when the number of FDHs surged, their impact on HK’s economy, as measured by their pay as a proportion of Hong Kong GDP, was significant – doubling from 0.4% to 0.8% overall:

Chart 3: Foreign Domestic Helper salary as a percentage of HK GDP

However, their input took a dive in the 5 years that followed 2002, dropping by 23% from the prior peak. Today the top 3 helper communities together make up only 0.645% of local GDP (Chart 3).

Changing national compositions driven by economies back home

So how has HK’s attractiveness fared in the eyes of the top 3 supply countries? One thing is clear – Thai FDH supply has gone on a one way decline for pretty much the whole of the last 20 years (Chart 6) reflecting HK minimum pay underperforming Thai inflation massively since 2000. On the other hand, Phils FDH numbers have by and large increased, except during 2000-2003 when HK pay fell most against Phils inflation; and only recovered meaningfully after GFC once the pay decline has reversed once more (red line in Chart 4):

Chart 4: Philippine FDH pay relative and population of Phils in HK

Chart 5: Indonesia FDH pay relative and population of Indos in HK

Chart 6: Thai FDH pay relative and population to Thai in HK

Indo was quite different from both Thai and Phils in that despite massive pay underperformance, the absolute number of FDHs continued surging, suggesting that our minimum wage must have been rich income for the locals such that drops vs local inflation has not dented the enthusiasm with which the locals wanted to earn more income in HK (see yellow line in Chart 5).

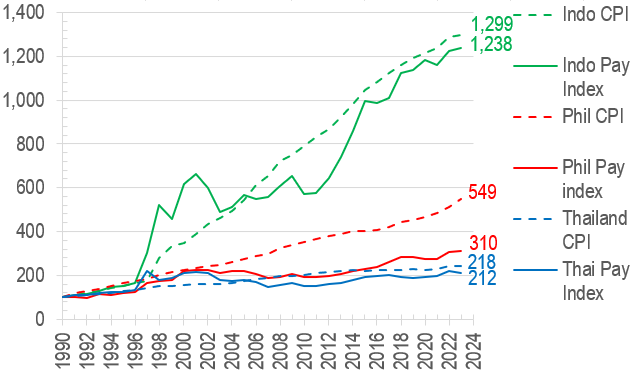
In the above charts, the ‘pay relative’ measures were arrived at using HK minimum FDH wages, translated into the local currencies back home, and divided into the local CPI, so the lines are a fair measure of how well the FDHs on minimum wages paid in HK compared to their compatriots back home. Put another way, the minimum income vs local CPI can also be expressed in separate lines, as shown here:

Chart 7: Indo/Thai pays were roughly in line with local inflation, but Phils pay significantly lost out to inflation


The above chart is also telling in that much higher Indonesian inflation over the period compared to Phils (lower by 60%) and even more vs Thai (lower by 83%) may have contributed to persistently higher FDH inflows into HK where price stability is a more important factor and USD based income considered a premium.

HKers have had it good, less so their helpers

Even so, the FDH minimum wage has still lagged behind the minimum wage levels applied to local Hongkongers (see green line in Chart 8), let alone local CPI index. In fact, from the employer’s point of view, their helpers’ wage bills have only gone up 58% over the past 33 years compared to HK inflation rising some 139% over the same period:

Chart 8: FDH minimum wage lagged the equivalent standards for locals, and both lost out to inflation in turn

The above, of course are purely based on the minimum wage measure, when there are a plethora of other administrative costs that is burdening employers on top (flight tickets, insurances, agency fees and other admin costs) which seem to proliferate constantly – perhaps on top of more equitable pay adjustments for the helpers, reform should also focus on how these new forms of administrative burden can be lessened for the hiring families?


The author would like to thank Yip Kin Long Tommy from City University of Hong Kong majoring in Accounting for assisting in data collection, analysis, and drafting this article.