顯示包含「ww3」標籤的文章。顯示所有文章

2024年5月31日星期五

SGP - Is Retail Property Price Peaking? 20240531

The combined favourable factors from capital flight due to the Ukraine/Middle East wars and HK's new national security legislation regime have massively pushed up investment demand for Singapore assets, thereby prompting headlines such as these of late:

>> Jack Ma's wife buys shophouses in ...Tanjong Pagar for $37m (article 1);

>> Bridgewater founder Ray Dalio joins billionaires snapping up Singapore ‘shophouses’ (Article 3)

>> Singapore’s shophouses — hotter than Fifth Avenue? (Article 4)

Whilst the first two headlines might be interpreted as 'smart money' making early moves, the last piece could be read as a sign of peaking market...

We continue to forecast a new macro environment that is different from the good old days of near zero interest rates and continued growth in global trade and productivity gains. Instead, we believe the new reality is one of decoupling, deglobalisation, and debt defaults, thanks to geopolitics and net zero / pandemic measures which not only will drive further inflation, but will undermine high economic growth.

One of the consequences of the combined higher for longer inflation and debt default scenarios is rates staying high, or return to 90s highs, if not even 80s high levels:

Above SGP interbank rates have already broken out of both the blue down trend as well as the lower horizontal resistance over the past two years. If the worse outcome does pan out as we feared, it might not be inconceivable to see rates hit 6.8% or thereabouts in the next 2-3 years.


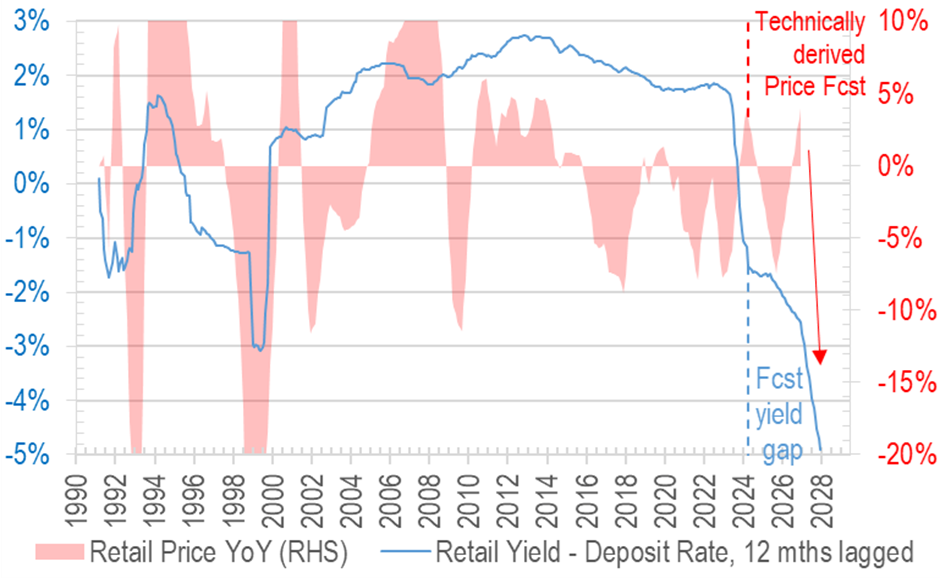
If Rent/Price moves can't match rate rises?

Using current trajectories in rent and price, we have modeled the near term yield increases, but sadly the rise in yields are not enough to offset the much more dramatic interest rate hikes, resulting in one of the more dramatic widening in retail yield discount vs deposit rates:

As a thought experiment, we believe this is probably as bad as it gets, because we are not factoring in the other capital flight which drove the rates higher - that from bonds. Perhaps the initial crack in bond market (when yields go north of 6%) will be negative for properties, but soon afterwards, the flight from bonds to real assets (may unfold as early 2026) will completely reverse price performances to the upside once more.

Based on this scenario, we think not all investors need to sell their safe haven assets (and indeed SGP shophouses are definitely safe haven in the world we live in now), if they can tolerate the price drops that happen before the final phase of the upcoming yield expansion cycle...

In the meantime, the very anaemic returns on retail property in SGP will continue to be a pain to tolerate, especially for leveraged up owners:


Could SGP retail further outshine HK in next few years?

The above wide gap between yield and funding cost does indeed support our near term bearish outlook on SGP retail assets, but if you look at the technicals vs HK retail property, SGP retail has broken out of the green downtrend, and could be hitting the blue channel top very soon (24% outperformance):

Should that level be also breached, there could be even more upside to the top red resistance (another 135% upside?).

Such a scenario probably can only unfold if HK retail see another major leg down, and that could only be driven by geopolitics rather than vanilla macro economics...


==================Article 1==================

Jack Ma’s Wife Buys Shophouses in Singapore’s Tanjong Pagar at Up to $37M

Beatrice Laforga | 2024/02/23

Despite stamp duties and investigations, wealthy mainland investors are still banking on Singapore properties, with the wife of the country’s best known tech tycoon having purchased a row of shophouses in the Tanjong Pagar area last month for a reported S$45 million to S$50 million ($33.5 million to $37.2 million).

https://www.mingtiandi.com/real-estate/finance/jack-mas-wife-buys-shophouses-in-singapores-tanjong-pagar/

==================Article 2==================

Shophouse sales surge and at higher prices in Q1 as high-net-worth investors return: Knight Frank

Samuel Oh | Fri, May 10, 2024 · 10:38 AM

In 2023, shophouse sales came to 132 units worth S$1.2 billion. The number of units was 31 per cent lower than the 191 units transacted in 2022 worth S$1.6 billion. Shophouse sales have fallen from their peak in 2021, when a total of 254 units worth S$1.94 billion changed hands.

[...]

Knight Frank projects the sales volume of shophouses to be between S$1.1 billion and S$1.2 billion for the rest of 2024.

https://www.businesstimes.com.sg/property/spotlight-1/shophouse-sales-surge-and-higher-prices-q1-high-net-worth-investors-return-knight-frank

==================Article 3==================

Bridgewater founder Ray Dalio joins billionaires snapping up Singapore ‘shophouses’

Investor’s family office bought two heritage properties for $19mn

Bridgewater Associates founder Ray Dalio’s family office has bought two multimillion-dollar “shophouses” in Singapore, as billionaires snap up the heritage properties in the city-state.

https://www.ft.com/content/9741784e-f69a-45cf-adf3-cc5b863c873f

==================Article 4==================

Singapore’s shophouses — hotter than Fifth Avenue?

Mercedes Ruehl / MAY 24 2024

Amid changing political dynamics in South-East Asia, these colonial-era buildings have become some of the world’s most expensive properties, home to Michelin stars and chichi retailers — and a target for money launderers

https://www.ft.com/content/e1a53cb8-5bf0-408a-91a0-bcdd738c0f11

2024年5月29日星期三

Is the big rush into Japanese property justified? 20240529

We have heard nothing other than 'we are buying Niseko ski flat' or 'our fund is adding Tokyo hotel' for the past few months, as if the rest of the world is all in the dog house...

Clients familiar with our arguments will know we have been negative for at least 2 years on the Japanese market, so this email seeks to give a more rounded exposition on why.

When crowds scramble one way, we go the other

The recent scramble for adding Japanese exposure (see Article 1) is in line with the concurrent rise in the Topix, but in property land there is even more momentum, especially amongst funds:


Granted, funds have been sitting on their hands in the past 2 years as interest rates globally spiked, and their IRR calculations were thrown into disarray. So the wishful hope that Fed rate cuts will be implemented (now proven wrong), plus a reversal of Japanese asset depreciation has sparked a sudden fad into pumping money into the land of the rising (may be now setting) sun...

We are very wary of the much more significant risk of Yen devaluation against whatever puny asset appreciation in the currency in the coming years however, and would prefer other jurisdictions where BOTH currency and asset prices will rise (regular readers will know where that is!).


FX should be central in investment decisions

The point of making price gains but adding translation losses is best illustrated with a view to history:


As shown above, during the haydays of Japanese industrial and cultural ascent, both asset prices in local currency (LC) and exchange rates were on the rise - see left green arrow. The combined effect for foreign investors is even stronger returns in USD terms (red line) than locals (blue line), shown by the purple enlarging triangle.

In the subsequent lost 2 decades, Yen basically went sideways (2nd green arrow), with price drops very comparable in LC and USD (purple parallelogram).

We are now probably into the next leg of Yen derating (see 3rd green arrow) thanks to shrinking population - see Article 3 - and the resurgent commodities complex when all input materials see price spirals. Unsurprisingly, since 2010, despite LC price gains, USD denominated values fell (purple trapezium).

We expect the next (final) down leg in Yen (4th green arrow) to unfold in the next 3 years or so, which can also destroy value for overseas investors (ie down red arrow despite up blue arrow).

To put it in numbers terms, below is a table showing the impact of Yen weakness (red shades) vs USD denominated Tokyo home prices:

Of course, the 2025-29 projections above are purely based on the arrows in chart above and may not play out the way we projected, but the risk that you get negative USD returns (2nd column from right) is very real indeed.


Macro picture for Japan: far from rosy

By the combined will to reintroduce inflation and to inflate away the mountains of govt debt (highest in OECD), the Japanese work force has been earning negative real income for the past two years:

In the meantime, the cost of living crisis left private consumption down for 4 quarters in a row, with little help to exports (net exports were increasingly negative in recent quarters) to contribute to GDP growth:


In the meantime, the geopolitical tensions between China and US is causing the rate environment to surge further, due to:

1) loss of demand for US debts by big traditional owners like China (fr 8.9% to 2.2% in 13 yrs) and HK, in fact Japan has also been falling in total proportion of US treasury holdings (fr 9.5% to 3.4% now):


2) Ukraine/Middle East conflicts likely to trigger more input price inflation, eg oil prices - and as a resource poor but manufacturing intensive economy, higher oil prices (blue line, down is higher prices) will tend to trigger economic contractions (red area). The green line is merely projecting prices returning to $150/barrel, which can easily be exceeded should international wars flare up again:


The result would be grim for Japanese economy. If wars spread to the APAC region, there is an added strong chance of capital flight from Japan given its recent militarisation movements might scare foreign investors away:


3) bond rout will impact Japan more than US - as US fiscal profligacy continues (yes, by adding $3.5tr debt in one year), long bond yields have nowhere to go but up (orange line), this will drag JGBs up with it (green line). Assuming totally benign geopolitical/sovereign debt calm conditions, the laughable 0.87% JGB yield will still nearly triple to 2.5%, and this 'benign' expansion of US-JP yield spread may trigger further capital outflows as money seeks higher returns in the US:


The result? Yen could drop another 25% to the 200 mark.

If this Yen drop becomes disorderly, it could result in JGBs trading at premium to TBs, leading to the much more nightmarish outcome of 10.5% JGBs vs say 8.5% TBs:


Such an outcome would mean Yen has to return to 270+ levels, much against the wishful sub-150 levels the 'anchoring biased' talking heads out there could imagine... or a 45%+ drop from current levels.


Real yields also too low to be attractive

Back to our usual real property yield table - Sydney/Singapore/Tokyo are some of the lowest returning markets on inflation adjusted basis (3rd column from right), compared to Phnom Penh/Athens which are our preferred investment destinations:


In a bond rout outcome, both European and Japanese markets will suddenly look much worse as US becomes the safe haven, thereby helping HK/NYC (2nd column from right).

Based on these various factors, we will only touch Japan if: a) long term fixed rate borrowing can be locked in; b) Yen leverage and/or hedge are put in place. But how many even the big institutions are taking these precautionary measures? We doubt many. On this note it is interesting to demonstrate how institutions are mere humans, however smart they otherwise appear: see Article 2.


==================Article 1==================

Interest in Japanese real estate grows despite rate rise prospects

Mar 8, 2024

Institutions and family offices are backing real estate for another strong year, despite the prospect of the country’s first interest rate rise since 2007.

​https://www.asianinvestor.net/article/interest-in-japanese-real-estate-grows-despite-rate-rise-prospects/494795​


==================Article 2==================

Hidden billions in Tokyo real estate lure activist hedge funds

Apr 16, 2024

The long-concealed market value of Tokyo’s largest skyscrapers is being unveiled by activist investors.

​https://www.japantimes.co.jp/business/2024/04/16/companies/headge-funds-urge-japan-real-estate-sales/​

==================Article 3==================

Japan’s Population Declines Again: Seniors 75 and Over Top 20 Million for First Time

Apr 24, 2024

An estimate published by Japan’s Ministry of Internal Affairs and Communications shows that the total population as of October 1, 2023, was 124,352,000. This was a drop of 595,000 (0.48%) from the previous year. It is the thirteenth consecutive year that the population decreased. The population of Japanese citizens was 121,193,000, for a record year-on-year decrease of 837,000, or 0.69%.

​https://www.nippon.com/en/japan-data/h01967/

2022年5月20日星期五

UK property – time to sell? [Article 2 of 2] 20220520


UK property – time to sell? [2 of 2]

In this second instalment discussing the property investment pros and cons for the UK, we will look more into the geopolitical and regulatory aspect of the investment environment:

4) Warfaring disrupts business, causes capital flight (to US/Asia)

The Ukraine conflict is perhaps just the beginning of a reversal of human war cycles, as we have bounced off the bottoms of more than one multi-millennial support lines in the early 1990s:

Chart 17: conflict fatalities may have hit long term bottoms and is turning up 


As the peace dividend from the fall of the communist bloc in 1989 recede into distant memory, could a new war hungry political set up be now in place to drive conflicts going forward? Is the ascent of a new economic super-power posing enough challenge to the existing order to lead to more hostilities?

With no ideological strive a la Cold War style (ie between communism and capitalism), what might be the next bone of contention in conflicts? Could it be domestic politics driven where international wars are mere diversions to avoid power loss at home? Could the jaw dropping inflations in commodities prices and food/energy shortages lead to resource wars?

We are now certainly in need of preparing, investment-wise, for a new multi-polar world, and the upheavals the breakup of existing order ushers in. One way to avoid being caught is definitely diversifying capital away from the main players of such conflicts (eg Europe, or even parts of North Asia – e.g. Japan).

UK, sadly sits too close to one of the main theatres of hostilities, and taking profits on existing exposures may not seem too bad a thing to do! Further, without the resource back up that some of our new target markets – mostly commodities rich ones – are endowed with, UK is less well positioned to weather the storm ahead:

Figure 1: Europe + Asia heavily rely on energy imports (red) vs Americas + Oceania (yellow/green) net exporters of the same


5) Chasing out the rich – has the selling only just begun?

The fervent confiscation of private property owned by individuals (see: indiscriminate seizures), who are not state operators in the strict sense of the definition, could be a last straw for any international investor considering the UK, as the current govt embarks on a capital hostile regime only seen during wartimes. Seizing Russian wealth without due process could be very dangerous for the country’s image as a safe destination for investment, and harks back the harsh Japanese imprisonment camps on USA mainland in WW2, not to mention what communist regimes did after successful revolutions (eg in Russia in 1917, China in early 1950s).

Whilst the ‘totalitarian’ enemy are abstaining from similar tactics, despite easily in position to confiscate western assets many times larger in Russia, the fact that a now ideologically driven UK takes the lead within the international community in asset forfeitures, without official declarations of war (which must be authorised by parliament?), or due criminal court judgments, really bodes ill for the future of London’s ability to attract investment.

Is it any wonder then that Superman KS Li (Hong Kong’s richest man) has sold in Dec 2021 his London Broadgate investment after barely 4 years of ownership for £1.25bn (a mere gain of 25%)? The fact that Cheung Kong often leads the market in catching cycles has been legendary and was amply illustrated by its HK$40.2bn sale of The Center in HK in 2017 which was mocked at the time but today its buyers are licking the wounds of their 25+% losses. Perhaps Mr Li has similar assessments on the deteriorating investment construct that is UK? Not only that, CK has further ramped up its UK disposals by flipping the much larger £15bn rump that is its power assets in March 2022 to Macquarie and KKR (see here).

The investment and jobs that would otherwise have stayed in the UK in the years ahead will now go for places less mob like, and more even handed, like Dubai (see article here). As succinctly observed by another commentator:

while many cheer the asset forfeiture of the evil Russian oligarchs, other nations can and will use this new tactic of war in the future. ... How could anyone feel safe investing in a Western nation if their assets will not be protected?

Western governments have exposed themselves throughout this pandemic, especially by letting us0 know they are not above coercion and silencing free speech [eg curfew in Australia, bank acc seizure in Canada, big tech cancelling of dissenting medical evidence]. The wealthy citizens are always the first to flee when a city or nation is failing.

this will totally destroy the world economy as we know it. Foreign investment in Russia will be seized, and the prospect of this migrating to China is extremely high. A line has been crossed. You do not go after the assets of private individuals claiming they are holding personal money for Putin. That would be akin to saying someone was holding money for any politician simply because they live under that leader’s rule.

This is a symptom of a major trend shift, and could mean a structural loss for most of the traditional Western cities in their ability to attract wealth in future from the Arabs, Chinese, Indians, and of course Russians…

Just to show how significant foreign capital is to the London market, see how much they have multiplied over the 11 years to 2021:

Chart 18: Land Registry titles with individual overseas owners – London a magnet for foreign capital


The 100s of thousands of property owners that felt UK was a safe place to park money may now have doubts and start heading for the exits, especially when the hostile political sentiment towards foreign owners continues to escalate (e.g. in the fashion shown in Figure 2). Capital has no loyalty, and will head where it is treated best.

Figure 2: UK no longer a safe haven for foreign capital?


We suspect that as China sides with the opposite side of the UK political narrative in this Ukraine conflict, it could be sooner rather than later that Chinese money (eg including investors based out of HK) would also be targeted for sanction/confiscation in this new norm of attack on private property. What if Taiwan becomes the next geopolitical hotspot? Will it be too late to pull out then? May be this is what Mr Li saw that prompted his disposal of UK assets?

6) Regulations Overload is becoming unbearable – for property investors

The assault of regulations on property ownership has been quite relenting in the past decade, as we have outlined in detail before here. But this has not stopped since, as the multiplying demands for compliance keep mounting, examples include:

a) Property selling now requires AML declarations, what red tape rationale is this? Below is a form from our property agents:

Figure 3: onerous form filling and reluctant law enforcement is now daily chore for landlords


b) Our accountants wrote to us below as they are no longer able to pretend compliance costs are negligible and will charge extra for sharing the burden:

You will note that the letter includes reference to a Compliance Surcharge which is a new item. You will undoubtedly be aware that all professional firms face ever increasing regulation and scrutiny, requiring a significant amount of additional staff and 3rd party resource to deal with matters such as:
• Anti Money-laundering legislation in onboarding and monitoring our clients
• Anti-bribery and Facilitation of Tax Evasion legislation
• Data Protection and GDPR requirements
• Increased regulatory compliance visits from professional bodies
• IT & Cyber Security

For some time now, we have been looking at the basis upon which we charge our clients. It is no longer sustainable for us to absorb these costs, which outstrip inflation in terms of growth.

…and apply a 2.5% Compliance Surcharge to our fees, as a direct contribution to these costs.

c) Green costs – the new ambitious EPC requirements could set back £13k-27k depending on the work needed for Grade D/E buildings, for details see article here; Hamptons calculated that in the North East, necessary upgrades would be equivalent to 83pc of the region’s annual rental income, according to Telegraph;

d) Green costs for commercial property too – according to Savills, proposed Department for Business, Energy and Industrial Strategy (BEIS) framework would ensure that all non-domestic rented buildings achieve a [even more stringent] minimum ‘B’ rating by 2030… 87% of the office stock has an EPC rating of ‘C’ or below. This is why we have also started disposing our commercial property in London on behalf of a client syndicate.

e) tax compliance becoming cumbersome – a prelude to much harsher regime to come? Here is an example of a form that non-resident landlords have to file to the HMRC, which no doubt will continue to lengthen going forward:

OVERSEAS BUYERS OF UNITED KINGDOM PROPERTY
RESIDENCE INFORMATION

During the Year:

Did you have a home overseas? Y / N
How many days did you spend in the UK?
How many ties** to the UK did you have?
How many workdays did you spend in the UK?
How many workdays did you spend overseas?

** Ties to the UK are defined as follows (references to "tax year" mean the year ended 5 April 2022) :
    1 Your spouse / civil partner / cohabitee or minor child was resident in the UK
    2 You had accommodation available in the UK for 91 days or more in the tax year
and you spent at least one night there
    3 You worked (for 3 hours or more) in the UK on 40 or more days in the tax year
    4 You spent more than 90 days in the UK in either of the previous 2 tax years
    5 You spent more "midnights" in the UK than in any other country

This body of complex requirements sets a costly trap for anyone who enjoys the English summer too much, or having sent kids to study there, not to mention those going for business purposes…

7) Demographics less bullish

Post-Brexit, UK's population growth should significantly slow, meaning lower pressures on the otherwise very tight housing supply (Chart 19), with the impact of EU citizens returning home a yet to be quantified negative factor:

Chart 19: very tight supplies in UK may unexpectedly ease 


Further, lockdowns also repelled a lot of international visitors (reduces demand for Airbnb / short stay), added to that student population drops from China (geopolitics), there may be more unexpected release of stock otherwise unavailable.

As a result of all of the above, we believe the UK market will face much stronger headwinds going forward, and better risk adjusted returns may be had in other jurisdictions. In any case for the optimists, we present another technically derived upside forecast as well, indicating possible rise of 14% (orange line) vs the most bearish case of 21% price drop (blue line):

Chart 20: technical forecast scenarios: -21% to +14% by end-25


Obviously, a lot of Hongkongers want to continue holding UK property for asset allocation reasons rather than return maximising trades. For all B&MM clients who feel action is needed as a result of this series of articles, we do provide such services.

Where to go next?

'Go East' is probably the answer, if you compare the world reality of barely two decades ago vs now (Figure 4); but if China risk is not your cup of tea, then derivatives thereon (including commodities jurisdictions that feed that growth) could well work... In the short term, however, capital flights from Europe (or even Asia) could mean USA might be the ‘least dirty of shirts’ in a world so screwed up with unparalleled amounts economic dislocations, political divisions, and military risks.

Figure 4: Asia and commodities are probably the lands of plenty in the long term 


The author would like to thank Benson Kong Yu Chin of The Hong Kong Polytechnic University for assisting in data collection, analysis, and drafting of this article.

2022年5月13日星期五

UK property – time to sell? [Article 1 of 2] 20220513


UK property – time to sell?

UK has been a good market for many HK investors, especially those who bought after the lows of GFC. Your writer has done even better by focusing on fringe markets which continued rising even when the prime central London sector crashed since its peak in 2014 – some popular development projects there having fallen by as much as 50% since:

Chart 1: prime central London underperformed by 14% since 2014 peak vs Greater London…


But with a plethora of negative factors now taking centre stage politically, economically, climatically, and on valuation grounds, we think the prospect of future rises, let alone outperformance, of the UK property market, is now much dimmed. Below is an extract of a longer piece we sent to clients, some key reasons for our cautious views are as follows:

1) Energy / food / hyperinflation => drop in real income, rise in civil unrest

2) Debt explosion + Rate surge undermining returns

3) Taxes must rise to service the rising rates, unsustainable welfare, and military spending

4) International wars cause capital flights (to US/Asia) and disrupt business

5) Chasing out the rich – the selling has just begun? e.g. Superman Li. The Saudis, Russians, and Chinese may not return if the seizure of private assets continue

6) Regulations Overload is becoming unbearable – for property investors

7) Positive immigration inflows may reverse after Brexit

Below we will look at all these factors in more detail.

1) Massive energy/food inflation drains disposable income, may trigger civil unrest?

The UK/EU construct, being heavily manufacturing and trade dependent, cannot afford to lose reliable and cheap energy imports, which was badly hit by supply shortages following covid lockdowns. This is now worsened as geopolitical tensions explode.

Just about every essential commodity, manufactured good, and service (eg imported labour) is now at critically low levels, stoking massive price hikes sometimes in triple digits. For example: reserves of arabica coffee, the higher-quality bean loved by espresso aficionados, have fallen to their lowest level in 22 years… prices on the ICE futures exchange rallied as high as 2.55 in Q1, up 140 per cent from 2020 lows:

Chart 2: Coffee inventory at multi-decade lows, and could worsen further as fertiliser/transport costs continue spiking

There has been widespread coverage of the energy shortage and price spikes so we will not go into detail here, one example being ominous The Telegraph warning on 18 Nov 2021 – well before even the Ukraine conflict broke out:

We are back to warnings of power rationing and industrial stoppage, a looming disaster for the European Commission and the British government alike

[Gas] Inventories are currently 52pc in Austria, 61pc in Holland, 69pc in Germany at a time of year when they should be near 100pc

Chart 3: UK less affected by Russian imports, but still can’t escape rallying global prices


UK is not as safe as the chart above suggests, as cross-Channel prices move in near lockstep, and the fact that the government allowed storage sites to close means the country may be nakedly exposed with just days of stock.

Further, the Hinkley Point C nuclear power station will not come on stream for another five years at best, and have banned, since 2019, fracking to extract easy oil resources.

Edging private sector to invest in fossil fuels is now more difficult than ever: ten years ago, the "cost of capital" for developing oil and gas was similar to renewable – at between 8% and 10%. Now, the threshold of projected return that can financially justify a new oil project >20% for long-cycle developments, vs renewables falling to 3%-5%, according to Goldman Sachs.

Chart 4: Cost of capital: very costly to start fossil fuels projects due to politics and ‘green imperative’ mentality

Why so high? Simple. Few want to lend to fossil fuel producers as stakeholder capitalism, ESG mandates, and identity politics infest corporate boards.

2) Debt explosion + Rate surge undermining returns

The West has sleep walked into a vicious cycle of:
(a) high welfare =>
(b) higher debt =>
(c) higher taxes when can’t borrow =>
(d) cut interest rates to -VE when can’t raise tax =>
(e) to buy political support, increase welfare (ie back (a))

This trick was easy to pull off from the early 80s when interest rates were as high as 15%, but now with EU at negative rates compounded by massive inflations every way you look, the game is OVER.

A slight increase in rates – when EM countries are now well equipped, after having gone through their own versions of debt crises (eg Asian Financial Crisis) – will cause the West into a painful reverse trade that threatens to rapidly unwind the past 40 years’ profligacy.

In the case of the UK, public debt has gone from 20% of GDP to 100% over 30 years (Chart 5), but all while interest payment fell from 10% of revenue to 3%. All of these are coming to a head now with collapse in confidence in public debt, triggered by govt mandated economic lockdowns, zealous push for green agenda, and now international wars:

Chart 5: UK public debt as post-war highs


Chart 6: Thanks to rate manipulation

The optimistic forecasts of OBR are probably based on low rates, low inflations, and strong growths after coming out of the lockdowns, but all of these assumptions are severely challenged, which could mean a debt explosion from the highest level since the 1960s to much higher levels than forecast below:

Chart 7: UK debt forecast likely too optimistic

Coupled to this the economy destroying zero-carbon ideology feverishly pursued by most of bureaucrats and politicians, the UK could see as much as 60ppts more in debt load in the next 30 years:

Chart 8: Climate change scenarios: public net debt impact by 2050-51

As international interest rates head higher, the ability of the slow growing OECD (mostly EU) to hold down their risk free rates will evaporate, as capital leaves seeking better returns elsewhere – all of this will lead to much higher finance costs for property very soon. The strong inflation backdrop (Chart 9) is also probably grossly under-estimated by the market, where low to mid single digit forecasts are still the norm, when we are already potentially looking at as high as 20%s levels (especially the 70s oil shock pattern repeats):

Chart 9: with war added to the mix of energy + food crisis, we fear UK inflation could reach double digits soon


Chart 10: Fed projected to hike 300+bps in next 1.5 years

If The Fed’s hike trajectory (300bps in 12 months) is anything to go by, given a weaker GBP (which means more imported inflation) plus higher energy uncertainties compared to continental USA, 400bps+ rate increases are a high probably outcome to us:

Chart 11: yield gap analysis suggests possible price falls 

As a result, even modestly assuming 300bps mortgage rate hike (Chart 11), the low property yields of today will feel a lot of pressure to catch up. Expanding yields mean higher rental growths are needed (69% in above scenario) just to keep prices from falling!

3) Taxes must rise to serve the rising rates, unsustainable welfare, and military spending

Part of the problem of high inflation and high interest rates is the erosion of profits at the corporate level and take-home pays at the individual level. It is no wonder that the government’s own forecast project the highest tax-to-GDP level since WW2 (Chart 12), adding insult to injury after the first two drags on people’s income:

Chart 12: tax take as % of GDP up 8ppts from 80s lows


Chart 13: 2019/20 to 26/27 tax increase by factor

All of this is in addition to the economic rebound nearing its peak, when corporate expansion intensions are starting to reverse:

Chart 14: CFO expansion survey – growth may have peaked

As rates rise, and inflation and tax bite, people’s take-home pay will likely drop, leaving them less money to invest in property, and we expect the record high P/E ratio (home price to earnings) to also turn south (Chart 15), perhaps having first made a dash for new highs by as late as Q3 2022:

Chart 15: Home price to income ratio also may peak by Q3 22

Looking at the complex picture in one condensed chart, we factor in income growth and interest rises against real home prices (ie after inflation) below, we present two possible scenarios:

1)      optimistic outcome where home prices stay unchanged (blue solid line, Chart 16) - the combined effect of inflation and income growth will make home prices a lot more affordable by 2026 (red sold line);

Chart 16: yield gap analysis suggests possible price falls 

2)      but what if the cycle we see in the red line repeats itself, and the red dotted line plays out by 2024 at the 700 reading on the real home valuation index? Such an outcome would require a home price drop of 37%, as represented by the blue dotted line.

The only possibility for home price drops not to happen is if income rises more than inflation (unlikely) and rate hikes are much less forceful than we forecast (also not high chance)…

Although our forecast contains a lot of forward assumptions, what we know for sure also is that the market has been too blasé about how the govts and central banks will be able to keep everything on a steady straight line (very typical mandarin thinking).

In the next instalment
Our discussion will continue in a second piece shortly, in which we will go back to more descriptive mode and go through some of the more real life examples of how and why owning and investing in property in the UK is now much more an uphill struggle compared to the ease it used to be barely 10 years ago... This aspect will very much weigh on the global collective sentiment towards this asset class going forward.


The author would like to thank Benson Kong Yu Chin of The Hong Kong Polytechnic University for assisting in data collection, analysis, and drafting of this article.