顯示包含「competitive devaluation」標籤的文章。顯示所有文章

2025年4月11日星期五

Macro – Tariff wars: property impact (mostly HK) 20250411

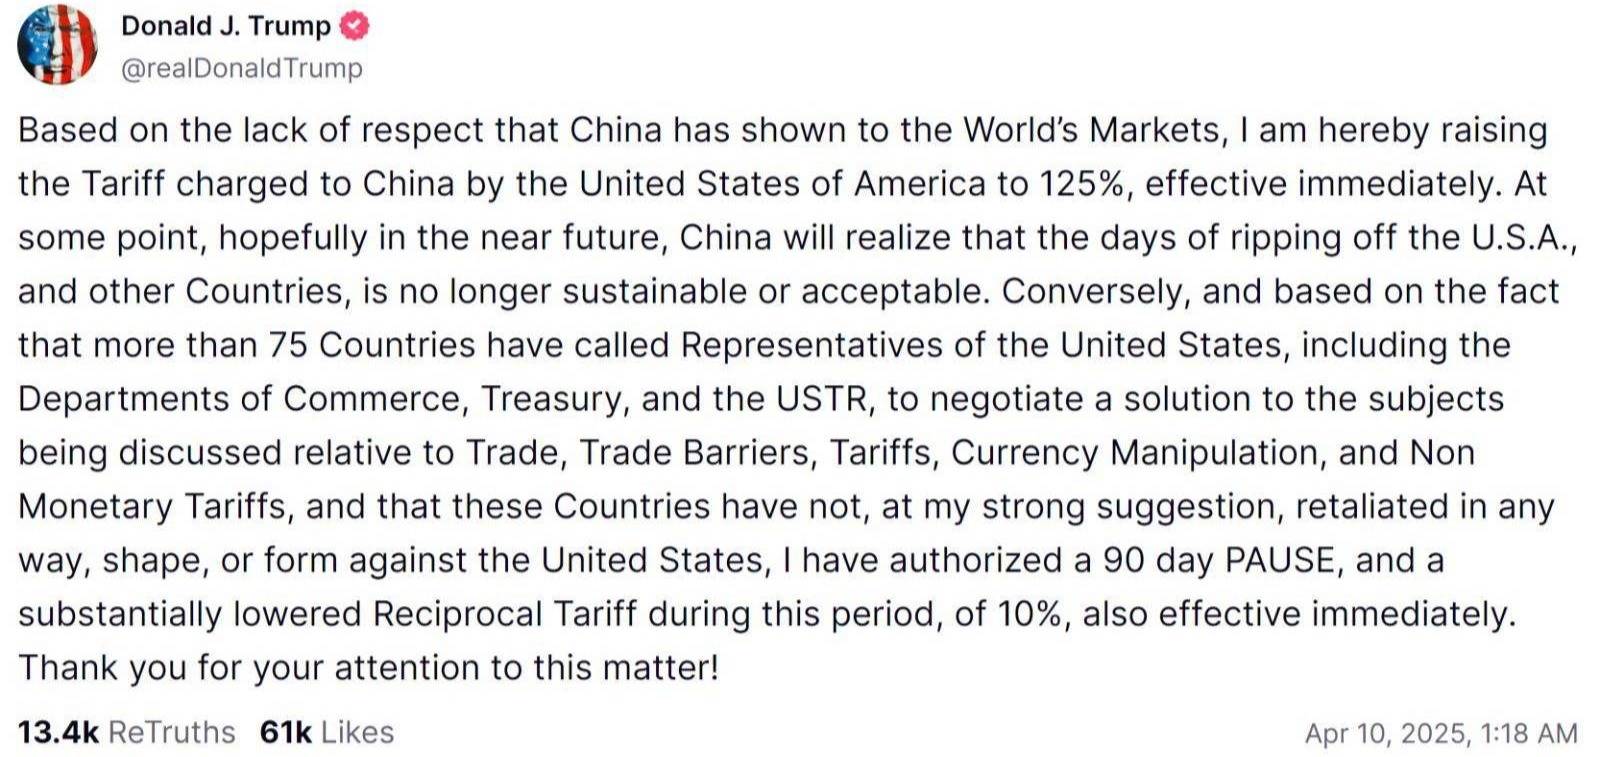
The Trump style of governance by social media makes it a very effective way to play out his Art of the Deal techniques, for example, this is his announcement of the latest rules overnight, from his Truth Social post:


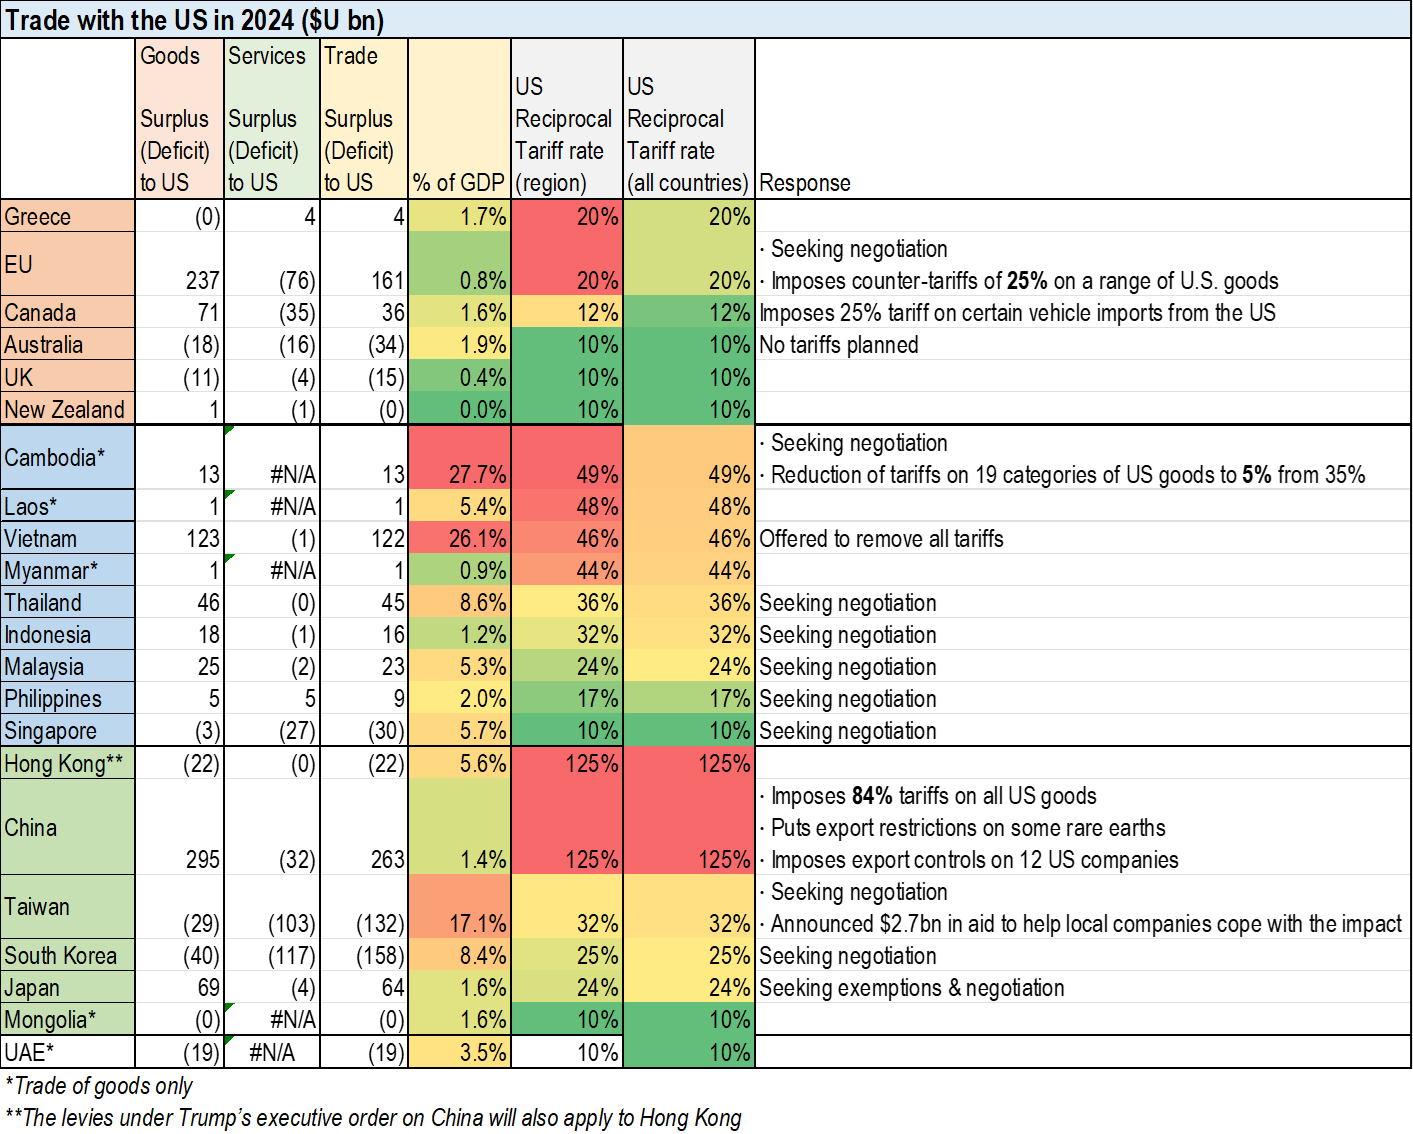
By throwing his weight around, initially with Canada and Mexico, then with EU, and now with rest of the world, it shows how powerful the US, as what I would call ‘the global consumer of last resort’, can really force agenda changes around the world, and how so many other countries buckled immediately (see updated response column):


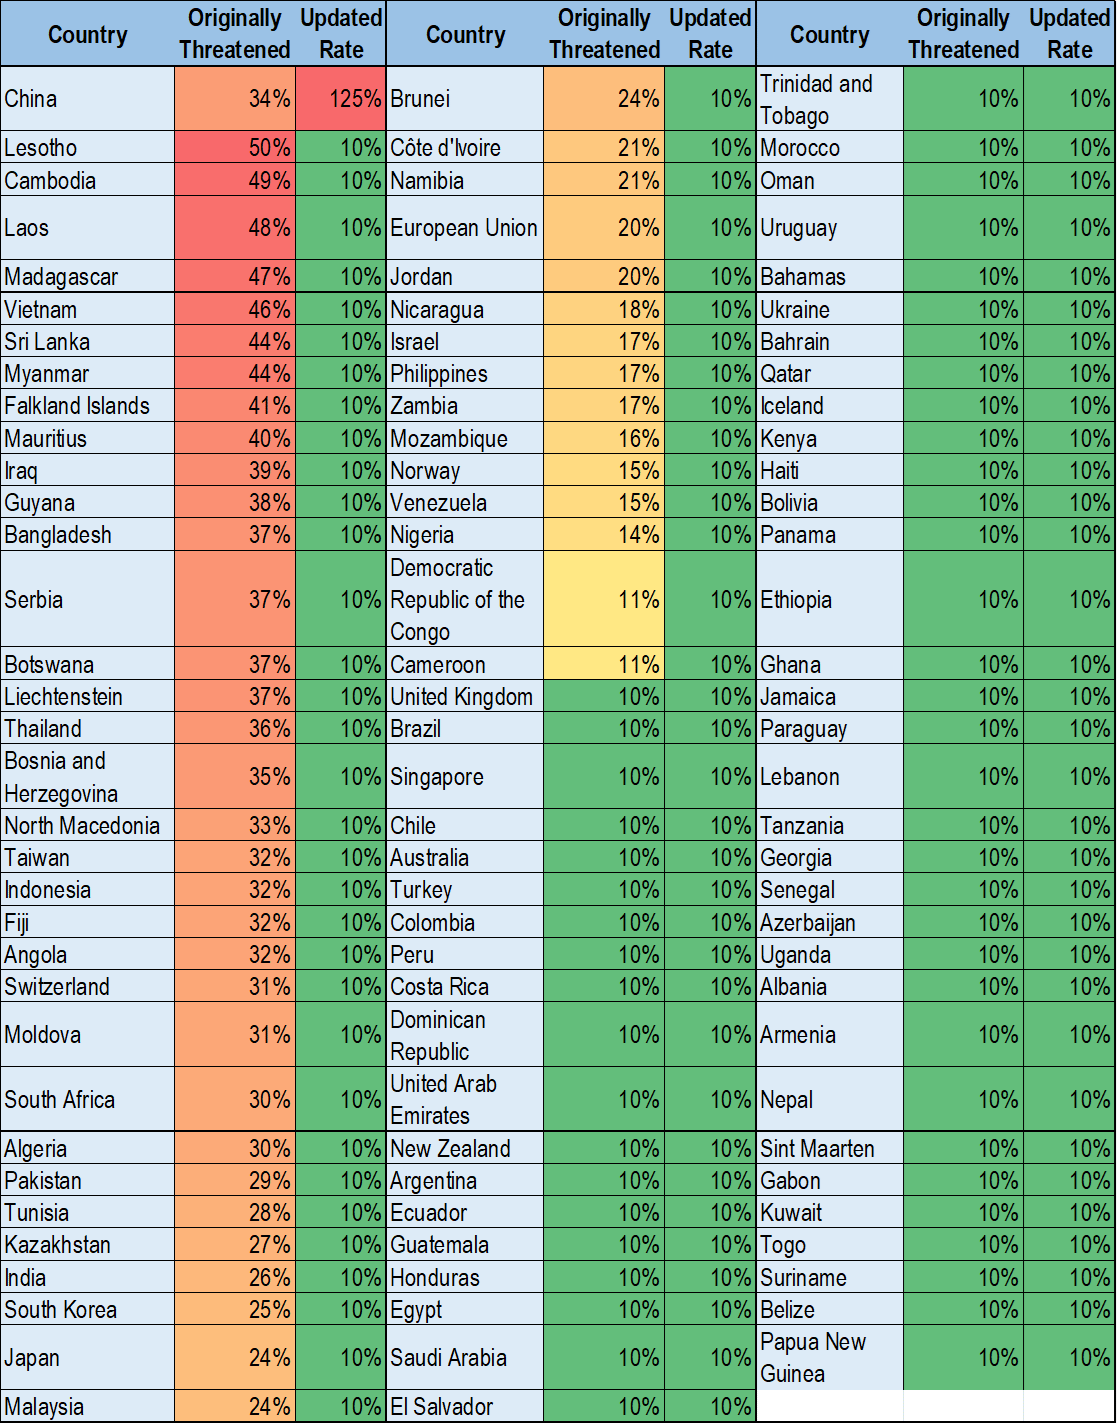
Not only is Trump quick to mount his assaults, he is equally rapid in retreating, hence today’s latest round of 90-day suspension reversal:


The violent reactions in the market is a good indicator we are in unchartered territory on this tariff issue. And the policy flipflops in the US is also contributing to the volatility.


We will chronicle the recent progress in section 1, before assessing the new geopolitical reality and how it will impact HK assets.


Fast draw, quick fire, and swift win?

Sole push-back from PRC – may still end in a deal?

The only one remaining resistance to the US tariffs is China. And what an escalation it has been (article 2, 5):


We are obviously worried this will escalate further, which will hurt everyone in the world, but are also quietly hopeful that rationality will prevail and a deal will eventually be struck. China does indeed have some powerful weapons in its arsenal, including:

a) dominant global trade position now – where it has the bulk of the international market as its partner, compared to the US, in other words, most other countries will suffer if they do not trade with China:


b) China’s large US treasuries holdings – some commentators worry about a sustained sale wreaking havoc on US’s debt and interest management:


But on closer inspection, CN’s holding of U$0.7trn of treasuries (red line above, is only 2.2% of total – red shade above), and even if they sold everything in one day, the impact would be less than 70% of the daily trade volume (black line below):


As a result we do not expect this as a meaningful lever to pull in the current trade dispute. The bigger worry should rather be how the rest of the world can keep increasing its appetite to accommodate the ever ballooning US treasury supply – now at close to $30trn a year in annual issues (bars in chart above).

c) RMB depreciation – basically for all countries facing tariff hikes, the easier route to offset (the obvious side effects of importing inflation aside), in fact, for low cost manufacturing nations, even triple digit tariffs may not result in manufacturing jobs shifting back to the USA (see article 7).

A likely outcome of the tariff war may well be the start of competitive devaluation to gain edge over other exporters. In the meantime, fast moving companies are already trying to beat the deadlines, but making dramatic moves like this:


d) escalation beyond trade – besides just tariff, both sides could get so entrenched as to start other forms of mutual sanctions, such as suggestion that US might delist PRC companies from US stock exchanges (article 6). This is where we worry most as the impact can spiral out of just trade, and hit many other sectors – eg the biggest risk to HK could be its open capital account needing access to the USD – in the most extreme case, could the HKD need to be depegged due to punitive measures from the US?

In fact smart US companies may already be plotting their exit of the HK/CN markets, and when sufficient proportions of the US corporate world have retracted (see article 4 where JP Morgan has sold its HK custody business), more severe sanctions would be much easier to be effected. Even countries are starting to view Chinese connection as a disadvantage, and siding with US in a potential geopolitical standoff (see article 1).


HK fundamentals – not too good either

Here are some factors that puts HK at risk and property prices on a downward bias:

a) Trade still too important a sector – with import/export accounting 9% of all employment in HK (light blue line), any trade spat is likely cause disproportionate amount of harm to local jobs and spending:


Total export has been seen to drive HK’s rents, and with trade falling, rents could also weaken:


b) Strong USD to depress local consumption further – it is already well aired that HK consumers are now spending weekends and holidays in cheap currency neighbours given the strong USD of the last few years. In a competitive devaluation scenario, this trend will undermine further HK’s domestic consumption – eg RMB is already down to its weakest level since 2008!

c) massive public housing supply about to hit the market – Yep, whatever the private developers hold back in supply, the govt’s usual pro-cyclical public housing policy will come to wreck the party: look at how strong the red and blue bars will surge in the next five years to take total supply in HK to the highest level since 2001:


We can only say – good luck to home buyers…

What are the possible good news from this?

This tariff episode may have its bright spots, however, such as:

– with tariff income, US can reform and abolish income tax as Trump promised;

– global markets cut domestic regulation / indirect taxes to appease the US, is structurally bullish for promoting free trade;

– China to launch massive credit easing to soften the blow => consumption spending up, trickle effect down to HK perhaps…

– HK and China both work harder to developer global South markets (article 3), opening up more diverse revenue streams in the process


=====================Article 1====================

Sino Chairman Robert Ng, Children Named Under Singapore Foreign Influence Law

2025/04/07 by Michael Cole

Singapore is set to declare one of its wealthiest property tycoons and three of his children as “politically significant persons” under a law designed to prevent foreign meddling in the country’s politics.

[…]

https://www.mingtiandi.com/real-estate/people/singapore-names-sinos-robert-ng-under-foreign-influence-act/

======================Article 2===================

China sticks to its guns as fresh US tariff threat pushes tension to the brink


BEIJING/SHANGHAI, April 8 (Reuters) – China vowed on Tuesday to “fight to the end” against U.S. tariffs as some citizens railed against President Donald Trump after he singled out Beijing for further levies, setting the stage for a standoff between the world’s two largest economies.

[…]

https://www.reuters.com/world/china-says-it-will-never-accept-us-blackmail-escalated-tariff-threats-2025-04-08/

======================Article 3===================

Hong Kong eyes Southeast Asian, Middle Eastern business ties in next chapter of belt and road plan

William Yiu 17 Feb 2024

Hong Kong will focus on business collaborations with Southeast Asian and Middle Eastern countries under the country’s belt and road plan, the head of the initiative’s local wing has said amid plans to launch a festival championing the scheme among residents.

[…]

https://www.scmp.com/news/hong-kong/hong-kong-economy/article/3252271/hong-kong-eyes-southeast-asian-middle-eastern-business-ties-next-chapter-belt-and-road-plan

======================Article 4===================

JPMorgan picks HSBC, StanChart to run $500 bln custody business in Hong Kong, Taiwan

By Selena Li March 1, 2024

HONG KONG, March 1 (Reuters) – JPMorgan Chase (JPM.N), opens new tab has selected HSBC (HSBA.L), opens new tab and Standard Chartered (STAN.L), opens new tab to operate its custody businesses in Hong Kong and Taiwan, with assets worth more than $500 billion, a spokesperson for the U.S. bank said.

[…]

https://www.reuters.com/business/finance/jpmorgan-picks-hsbc-stanchart-run-500-bln-custody-business-hong-kong-taiwan-2024-03-01/

======================Article 5===================

Beijing prepared for US tariff retaliation: Regina Ip

2025-04-08

The central government is well prepared and has a broad arsenal to respond to any further tariff escalation by US President Donald Trump, according to Executive Council convenor Regina Ip.

[…]

https://gbcode.rthk.hk/TuniS/news.rthk.hk/rthk/en/component/k2/1799392-20250408.htm

=====================Article 6====================

Delist Chinese stocks from US indices? Trump administration says ‘everything’s on the table’

9 Apr 2025

US’ Secretary of the Treasury Scott Bessent has said that “everything’s on the table” when it comes to removing Chinese companies from American stock exchanges, amid the ongoing tariff war between Washington and Beijing.

[…]

https://economictimes.indiatimes.com/news/international/global-trends/delist-chinese-stocks-from-us-indices-trump-administration-says-everythings-on-the-table/articleshow/120128240.cms?from=mdr

=====================Article 7====================

Trump’s tariff own-goal

David Webb 3 April 2025

He apparently has no idea how much this will hurt US consumers and how little it will affect the trade deficit. Asian manufacturers and their investors can, to a large extent, sleep easy tonight.


[…]

https://webb-site.com/articles/trumptariff.asp

2012年12月12日星期三

To earn one’s keep – why is fiat currency deonominated nominal growth misleading?


UK earnings have grown 330-fold over the past century

Did you know that in 2010 the average UK worker earned £23,000 a year, 6% above pre-crisis 2007 earnings? This may seem a good outcome given that the country’s economy weathered through a global financial crisis during that period. But, if we look at this in real terms, workers are actually worse off by around 2%.

Looking back further, over 10, 20, 50, even 100 years, earnings are up even higher – 42%, 120%, 4,200%, and even 33,000% respectively. But are British workers genuinely better off financially compared to the years 2000, 1990, 1960, or 1910? One way to answer this question is to look at earnings in real terms, which at 8%, 25%, 140%, and 316% respectively indicate some genuine improvements in people’s income over these periods. However, on an annualised basis, these gains become much reduced at 0.8%, 1.1%, 1.8%, and 1.1% respectively, with the pace of growth also having slowed over the past 50 years.

Explaining growth over the centuries

During the period for which earnings[1] data is available (1209-2010) there are seven identifiable sub-trends, which can be explained by various social, political, and economic factors [heading numbers below correspond to arrow labels in Figure 1].

1)   Growth declined up until around the turn of the 14th century – due to medieval over-population, land shortages and depleted soils

2)   A fast growth period between 1310 and 1380 – possibly due to the large loss of lives from the Great Famine of 1315 and the Black Death of 1348, driving up wages

3)  Slowing growth between 1380 and 1509 – likely due to the efforts of parliament to curtail upward pressures on wages and prices, as well as the effects of the late medieval economic recovery coming into play

4) Falling earnings between 1500 and 1600 – Much like how the large drops in population and subsequent shortages of workers had pushed up wages during the 14th century, the rapid rise of population in 16th century meant that wages fell. This was worsened by rapid inflation around the middle of the century.

5) Growth resumed between 1600 and 1800 – coinciding with the early beginnings of the English colonial empire and the East India Company – both of which brought about greater economic activities and wealth repatriation

6)  Post-industrial trend with elevated growth rates between 1800 and 1945 – likely caused by greater political stability following the Acts of Union, the economic benefits of the Industrial Revolution as well as expanded international trade

7)  Finally we have the fastest earnings growth trend in history since the end of WW2 (1945 onwards) – we will discuss this period below

Figure 1 – Average Annual Real Earnings (in 2010 £s)
 
As shown by the chart above, the UK’s average real earnings have remained on an exponential growth path, with an especially accelerated pace since 1800s [green dotted lines in Figure 1]. But unless there are unlimited resources (and unlimited new markets to earn ever bigger incomes), this growth will have to slow down. If the drops in real earnings since 2008 were not a blip but part of a larger trend [see trend line in Figure 2], could the stellar growth path that has marked the UK’s prosperity over the past few centuries be beginning to change course?

Figure 2 – Real Earnings Growth since 1950 (Entering negative territory?)


Nominal growth provides only a psychological sense of improvement

The above charts showed real earnings trends. However, real drops in earnings (or living standards) are masked by nominal figures. The best recent examples of this are the First and Second World Wars. During WWI, real earnings fell from 5,957 to 5,047 (down 15% by 1918) [Figure 1] whereas over the same period, nominal earnings went up 67% from 80 to 133 [Figure 3]. The same disconnect between nominal and real figures can also be seen during WWII, during which real earnings fell from 8,214 to 7,195 (down 12% by 1945) [Figure 1]. Meanwhile, nominal earnings went up 26% from 170 to 214 [Figure 3].

The temptation has always existed for governments to dilute the values of their currencies, and with difficulties in delivering all policy promises, this temptation only ever grows stronger. As paper currency became more widespread in international transactions, the temptation to depreciate competitively has also grown to its highest.

While the UK’s departure from the Gold Standard in 1931 was due to multiple factors such as a fall in the competitiveness of British exports, the pressures of growing unemployment, as well as aftershocks from the global recession of 1929, the change certainly helped boost nominal earnings growth from a long term average growth rate of 0.46% [blue dotted in in Figure 3] to a new ‘paradigm’ of 5.66% [green dotted line in Figure 3].

Figure 3 – Average Annual Nominal Earnings


Towards the slow end of the S-growth curve

Though it may have felt good to keep delivering nominal growth year in year out, the departure from the Gold Standard might have become the first injection of the growth drug that gets governments hooked – the 1931 move gave us the first decisive departure from the centuries-old trend [a move from the blue dotted line to the steeper green dotted line in Figure 4]. 

Figure 4 – Average Annual Real Earnings (in 2010 £s)


In 1971, the USA also joined in the wild party of ‘currency depreciation and global credit expansion’. This helped the UK achieve a second burst of even more rapid nominal growth [orange dotted line in Figure 4] that lasted until the UK property bubble finally burst in 1988 [black dotted line in Figure 4].

What is more worrying is that the 1988 popping of the UK property market could have been deeper (but in the longer term, healthier) if the biggest excesses, driven by Mr Greenspan’s ZIRP (Zero Interest Rate Policy) had not pushed the global asset bubble to its peak. The UK enjoyed a few more years of higher growth in the 90s and early 2000s, but the hangover that followed will take much longer to heal, with a likely consequence that a prolonged period of fundamentals driven, rather than credit/liquidity/leverage propelled growth will be needed. Even assuming UK earnings growth bottoms out within the post-1931 trend channel, at the centuries long 0.46% growth rate [purple line in Figure 4] it will be 2013 (to trend mid-point) or worse, 2027 (to the bottom of the trend channel) before the current correction is complete [see Nominal growth chart in Figure 3].

Measuring earnings with real money

Before the ‘new era of fiat money’, marked by the UK’s departure from the Gold Standard, earnings as measured by gold and by government-backed paper money had almost identical purchasing powers [see the two near-parallel dotted lines in Figure 5]. However, this relationship broke down during the 20th century.

Whereas the purchasing power of gold has continued along its long term trend even into the 20th century [purple dotted line, which is parallel to the prior blue dotted line, Figure 5], the ‘growth’ as measured by flat money has grown to parabolic heights. Could this signify that British ingenuity, inventiveness and productivity (as far as economic activities are concerned) has not fundamentally changed (as measured by gold), but that the boom represented by the nominal line [as measured by fiat currency, orange dotted line, Figure 5] had created a far more positive picture than reality? Is it possible to draw the conclusion that the invention of the internet had no more powerful an impact on the British earnings power than the discovery of the new world?

Figure 5 – Earnings index (in ounces of gold) vs. Earnings index (in nominal £s)

The accelerated erosion of the Pound’s purchasing power since the departure from Gold Standard is also illustrated by the fact that it took nearly 700 years for the currency’s purchasing power to fall by its first 90% in the period under our study. In comparison, the next two 90% drops in purchasing power both took place after 1950 and only took drastically shorter periods of around 30 years each! [Figure 6]

Figure 6 – Drops in GBP purchasing power (Indexed currency depreciation)

Conclusion and outlook

What the above discussion shows is that if the world’s governments succeed in maintaining this façade of fast nominal economic growth, people may not enjoy real increases in their welfare or standards of living. On the other hand, the risks of such a nominal growth driven economic strategy, with ever greater government intervention in increasing number of asset classes, imbalances in the global economy will only increase.

It might be that we will not only succeed in avoiding nominal economic growth slowdown as governments planned [blue arrow in Figure 7], but overshoot wildly beyond what is already a near vertical growth path, leading people to lose confidence in the currency altogether. So instead of the more painful red line (at the previously discussed historic level of 0.46% growth), we might see breakdowns in the status quo of economic policy making.

One of the possible consequences of a complete loss in confidence would be Zimbabwe-style hyperinflation [green arrow in Figure 7]. The line between deflation (which governments are fighting in the Western world) and hyperinflation (should their policies fail) could be very thin indeed.

Figure 7 – Nominal Earnings growth entered an exponential path in 20th century


[1] ‘Average earnings’ has a broader meaning than just wages, and includes other forms of compensation (from payments, bonuses and commissions to overtime supplements). ‘Real earnings’ are adjusted for inflation in 2010 pound term).

This article was researched and written with significant input from Charles Appleton, whose contribution is greatly appreciated.