顯示包含「Shenzhen」標籤的文章。顯示所有文章

2025年7月22日星期二

China - Has Home Price Bottomed Yet?

China has been on a long property cycle correction; although not the longest fall compared to the 97-03 cycle, it certainly feels like the deepest drop experienced - down 39% from the 2021 peak in Shenzhen for example:

The drop has triggered a lot of support measures in recent months, ranging from policy relaxations to rate cuts. Whilst prices are now back to 2015 levels (red line above), price-to-income ratios have seen even deeper correction - the price-to-disposable income ratio (green line above) is now back to 2007 levels, a full 18-year roundtrip! The less relevant price-to-per-capita-GDP measure has returned to 2015, similar to the price index correction (blue line).

If we looked further back to the Asian Crisis period, the drop in price-income ratios has taken us to even the 1999-2001 period. So are we near a bottom yet?

Cycle bottom near, but not there yet

The market has recently shown some signs of recovery, as the first shoots of rebound has appeared in price statistics - the latest monthly YoY numbers has registered one recovery (green bar below), after the longest period of all cities reporting drops (red bars) continuously since 2024:

Shenzhen price moves (red line above) has always been a lead indicator of national trends - each time the line turns up, the number of cities reporting price rises increase. This time however, the SZ line has not made a reversal yet, suggesting perhaps the odd city rising in the latest monthly stats is but 'counter-trend rallies' rather than trend changes...

This assessment is corroborated by stock analysts out there too, see article 1 for details. The still negative outlook is justified given still very strong global headwinds in both trade wars (article 3) and proxy hot wars, which can both flare up further. On the micro side, the inventory glut remains in need of digesting:

for more charts see here

Both geopolitics and weak retail appetite has been weighing on China's business sentiment, which has stayed in contracting territory in Q2, following a longer period of drops for most of 2023-24:

As a result, both consumer (blue line below) and producer prices stayed neutral (at best) to negative:

The saving grace has been the aggressive rate cuts carried out by the PBoC, taking funding costs to levels significantly below HK/US levels now:

However, the pressure from rate arb is now mounting, especially when most Western nations are seeing their long bonds crash driving up rates. We don't expect this trend to end any time soon, and as a result, China's near record discount vs TBs could be due for mean reversion:

What is the bullish case?

For Shenzhen specifically, the strong momentum of Hongkongers consuming up north seem to be providing some support (article 2), and as the porosity of the SZ-HK border continue to increase, price equalisation could have some further legs to run, benefiting the prices there (more than most other cities).

The rate cuts and increasing rental yields are also tilting fundamentals in favour of owning for end users, and buying for investors. The negative yield gap (currently around 2%, see blue lines below) for home owners however could recover more before buying demand returns in numbers:

As a result, we expect likely another 100-200bps of narrowing - either from rental growth or further rate cuts - before prices begin recovering meaningfully. The timing seems to be more likely 2027 on current trajectories from the chart above.


=====================Article 1====================

Goldman Sachs Says China Home Prices May Drop 10% Before 2027 Market Bottom

2025/06/26 | Iris Hong

China’s property slump could extend into 2027 with a further 10 percent decline in home prices, as policymakers remain cautious about easing measures, according to a Goldman Sachs report released on Wednesday.

[…]

https://www.mingtiandi.com/real-estate/research-policy/goldman-sachs-says-china-home-prices-may-drop-another-10/

=====================Article 2====================

Benefits of Shenzhen/Hong Kong tourism mainly flow one way

2025/06/12

[…]

While Hong Kong tourists travel north to take advantage of cheaper hotels and restaurants, Mainland tourists arriving from Shenzhen are more inclined to take short trips and focus on sightseeing rather than shopping and restaurants. Shenzhen has now overtaken Macau as the most popular weekend destination for Hong Kong residents.

[…]

https://www.savills.com/prospects/cities-benefits-of-shenzhen-hong-kong-tourism-mainly-flow-one-way.html

=====================Article 3====================

Trump Says He'll Set 50 Percent Tariff on Copper

2025/07/08

[…]

“Today, we’re doing copper,” Trump said at a July 8 Cabinet meeting in front of reporters. “I believe the tariff on copper, we’re going to make it 50 percent.”

[…]

https://www.theepochtimes.com/business/trump-to-impose-50-percent-tariff-on-copper-5884328


2024年3月22日星期五

Barbarians at the gates – will mainland eateries flood HK’s F&B scene? 20240322


One of the hottest topics in dinner conversations of late has been Hongkongers shopping or even spending weekends in Shenzhen, even major media channels are reporting the phenomenon (eg. in SCMP and NYT). The scale of the outbound outpouring is not restricted to just Guangdong of course, given how locked down HK has been during 2020-2023, and how strong the HKD has risen against other currencies of late.

This thirst for new and affordable cuisines and services should not have escaped the attention of any ambitious PRC brands – in fact the southbound march has begun in earnest already (as seen in this Singtao piece). We have found some examples of recent PRC brands opening here:

Figure 1: MuWu BBQ

Figure 2: HeFu Noodle


Figure 3: Tai Er Pickled Veg Fish


Figure 4: Tan Yu 


So how big are the potential inroads these Mainland brands can make in HK? We start by looking at a Top 100 PRC Restaurants for 2023, which covers some 219,000 outlets nationally to assess likely impact of shop openings in HK. The top 30 names from the list is shown here alongside their scores and franchise sizes:

Table 1: Top 100 PRC food & beverage brands and their cuisines


Charting food preferences in China

By analysing the breakdown of the top F&B chains into their cuisine and types of foodstuffs, we are able to peer into the modern taste of the Chinese urban population at large.

First, by cuisine, Sichuan cooking has the highest number of chains operating across China (16 of them, followed by beverage brands at 13, see blue bars below):

Chart 1: Top 100 PRC brands/outlets by cuisine 

Sichuan cooking is also the 3rd highest cuisine by number of outlets (orange marks above), closely following beverages at #1 and American at #2.

Together, almost 30% of Top 100 PRC F&B outlets offer Sichuan and Guangdong cuisines. Most surprisingly however, of the 23 cuisines charted above, Shandong and Jiangsu ranked #23 and #19 respectively despite their reputation as part of the ‘eight major cuisines of China’!

Made to order & fast food dominate food types

When it comes to type of foods, it is unsurprising to see people wanting their individual tastes catered for, resulting in cook-to-order (also known as 小菜) chains ranking first by brands (1st blue bar below). We think this more labour intensive way of catering should be dominated mostly by smaller chains in the list, not to mention millions more even smaller eateries not in the top-100 list.

The next biggest entries are all easy to cater, volume business type foodstuffs, such as hotpot, beverages, fastfood, burger, pizza, and the like:

Chart 2: Top 100 PRC brands/outlets by food type – mostly fastfood varieties 

Also unsurprising is how these fastfood outlets – handshake beverage, Chinese fast food, fried chicken, Chinese braised meat (or 滷味) – given the economies of scale due to fast turnover and large volumes came high in the ranking of number of outlets (orange marks above).

Why is Guangdong cuisine so underrepresented?

Despite the freshness, high creativity, and widespread availability around the world, it was surprising for us to note that Guangdong cooking was probably the most underrepresented cuisine in the top-100 list:

Chart 3: Brand % vs outlets % - high penetration from fastfood vs low presence from Guangdong 

In fact, as is clear from the chart above, Guangdong cuisine is the furthest away from trend in relative proportion of branches as well as outlets. This unexpected pattern might be explained by the need to have fresh ingredients many of which from warm climate, and proliferation of seafood dishes which call for proximity to the ocean, and possibility of the more skilled preparations required (eg more frying rather than braising) which limits the availability of proficient cooks being available to staff the kitchens…

Drinks and mass fast food items dominate market shares

In the food type domain, the same factors are at work in deciding which type is abundantly supplied (fastfood category food, see blue labels below) compared to those serving cook to order food (red label) where complexities in diners’ orders results in a smaller number of brands operating but is compensated by higher number of outlets (in fact the highest category by food type):

Chart 4: Brand % vs outlet % - Food Items 


How do Shenzhen and Shanghai measure vs national average?

We next look at how brands enter top cities (we chose Shanghai and Shenzhen) to gauge how each city has its own appetite, as well as if opportunities exist for under served cuisines in these cities.

It is interesting to note that in Shanghai, the over populated brands (red names below) appear to be dominated by listed companies from HK and benefited from easy access to capital market for their expansion plans. On the other hand, the underpenetrated brands tend to be regional brands which may have a lower mind share or ‘prestige’, thus explaining their under penetration in Shanghai (ie population implied outlet numbers are much higher than actual outlets, eg. Shuyi and CHAGEE):

Chart 5: SH - population implied outlets vs actual outlets

The pattern is even more interesting in Shenzhen – the one phenomenon that stands out here is how the city is highly penetrated by local brands and cuisines – Hakka and Guangzhou already point to the geographical proximity of their cuisines, while ZhenGongFu and Muwu are both locally grown brands:

Chart 6: SZ – population implied outlet numbers vs actual


HK to see a torrent of new entrants yet

Set aside the fact that HK may be at equilibrium in its number of F&B outlets, the large number of PRC hopefuls to establish a bridge head here, or simply to use HK as a marketing medium given its international status, should suggest that a large number of the top F&B brands in China will continue to come this way.

So how do we estimate the likely inflows? With Hong Kong and Shanghai both being gateway cities, it may well be a good proxy to use the Shanghai F&B population as a proxy of likely concentration of eateries present there already but not yet entered HK yet. Below is the result of our projections:

Chart 7: SH population implied outlets vs actual numbers in HK

Funnily, the Shanghai concentrations suggest that Café De Coral is over populated in HK, and could be in need of some trimming in numbers. However in its place there are dozens of just the top-100 brands that will want to open up here, as shown by the whole bank of orange marks on the left. All of them, given their own concentration in Shanghai already, should mean hundreds of new arrivals in HK in the months and years ahead – the thinner arrow above suggests each brand with >10 outlets, and those behind the fatter arrow suggests single digit openings.

Applying the SH mix to HK, here is a league table of top brands that need to open shop here:

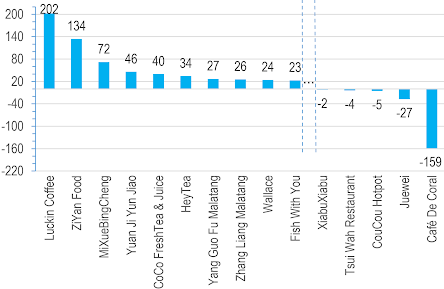
Chart 8: HK brand potential – most likely entrants and leavers charted 

The results are an incredible number of new beverage outlets to come, at roughly 300 stores from the above chart! Factors outside the above quantitative analysis however must be factored in when making predictions, for example, how heavily penetrated are local HK coffee shops already – you can hardly not bump into specialty barista cafes anywhere you go these days, have they already filled the gap of the Luckins of the world? What about the local traditional herbal tea brands that may reduce demand for mass PRC milk tea offerings like HeyTea?

On the flip side of likely inflows, we may have an oversupply of brands in HK such as Juewei which specialises in duck necks (?!), and local champions like Café de Coral may also see leakage of its traditional customer base as the HK product mix enriches with new entrants…

Retail demand from new entrants – not material

So how will this new onslaught of new brand openings in HK bring in terms of new retail floor space demand? Our modelling suggests some 0.55m square feet of new entrants from the top 100 brands, which when benchmarked against HK’s retail stock at 130m square feet, is but a rounding error – or a mere 0.45% boost. It is exciting nevertheless as a consumer to see new offerings which increases shopper choices and introduces new ways of eating/drinking which can only enhance HK’s reputation as a ‘paradise of food’ even further…


The author would like to thank Yeung Ching Wa Oscar from City University of Hong Kong majoring in Finance for assisting in data collection and analysis of this article.

2024年2月23日星期五

Will HK fall more than SZ? 20240222

HK property is facing significant challenges, in the new reality of being increasingly viewed as 'another Chinese' city. Will this mean prices will fall more than its brethren in the north (or rise less if market turns up) henceforth?

We look into a number of factors that influence the outcome of this interesting investment dynamic, perhaps starting with the bad news first:

1) Chinese outbound tourists bypassing HK (bad)?

As more relaxations are introduced/restored for visa free entry to global destinations (right column in table below), PRC tourists may bypass HK even more and head for exotic climes directly:


This trend of disintermediation, is also manifesting with more overseas countries given visa exemptions for visiting China (left column above), a factor further compounded by increasing flights from gateway PRC airports to overseas cities, reducing the hub role HK has long come to enjoy.

2) Rising retail standard + cheap RMB => surging northbound HK shoppers (bad)

As amply illustrated in article 1 below, increasingly sophisticated retail offerings in PRC cities, more spacious physical hardware, (sometimes) better services, and of course cheaper cost is now triggering a new phenomenon where HKers go spend weekends in SZ for leisure and even for grocery shopping.

In office space alone, more companies may be tempted by the now Grade A spec but much more affordable occupation costs up north:

Global Occupier Markets: Prime Office Costs – Q4 2023

HK office costs are still 3x prime SZ equivalents, which coupled with cheaper labour, may entice increasing numbers of businesses to set up north of the border - especially if travelling on the High Speed Rail, one can be in Futian from Kowloon West in a matter of 14 minutes, on fares (book yours here) cheaper than the cost of a cup of Starbucks ...

It is worth noting also that occupancy costs fell across the board in the China/HK markets in Q4 23, compared to mostly rises in other global cities - showing how weak the domestic economy was then, and why the Chinese govt had to pump prime to save the property sector in recent weeks.

3) PRC rate cuts vs Fed rate hikes (bad)

We have long maintained that wars and deglobalisation will only worsen inflationary pressures, and that this would leave little to no scope for rate cuts by the Fed:


On the other hand, the need to reflate domestic consumption is leading China to stage one rate cut after another (article 3):
LPR = loan prime rate

What's more, the still high real interest rates in China allows it ample further scope for credit easing - some 150bps vs US, and nearly 280bps vs UK):

The conclusion of this rate trend divergence is best illustrated in the chart below:

Whenever HK rates hike less than PRC rates (green arrows pointing up, eg 1992, 2006), HK prices tend to rise much faster (red arrows up). The reverse is the case when HK rates rises more above PRC rates - which is where we are now - prices underperform SZ (eg 1996, 2013 to date).

With the rate picture increasingly looking like HK rates staying high while China cuts further in the coming year (rightmost green arrow above), HK residential premium over SZ will likely shrink further in the coming two years.

4) Facilitating Southbound flows (good)

The HK govt has been tapping into the rise in PRC wealth and talent by attracting them to settle in HK (article 2), but this is not radically different from some other immigration schemes already in place, and perhaps does not have as strong an impact as in earlier years.

Similarly, attracting more southbound shoppers is nearing its potential (we already have 49 cities on easy travel arrangements, see article 4), and thus will unlikely result in any quantum leaps with further relaxations.

5) Higher SZ base good for higher HK too (good)

As can be seen below, the premium in HK prices remain quite substantial over SZ for comparable luxury estates (Residence Bel Air in HK vs Seaworld Shuangxi Garden in SZ):


Whilst global comparison suggest that our current 120% premium may be too high - eg NYC Midtown is 50% premium over San Fran, and 63% premium over NYC Downtown - perhaps the shrinkage of the HK-SZ premium is largely done. Hopefully SZ price increases will do most of the catch up work rather than even deeper HK price drops...

Looking forward, we think a combination of the two remains the most likely scenario; here the Price-to-income ratio trends suggest that SZ prices will improve by some 12% in the coming year or two whilst HK might see a larger 30% correction. For HK, the bulk of the improvement will have to come in price correction rather than income growth:


6) Yields already safer than many global cities (good)

A saving grace for HK at least is that its real property yield is already quite 'reasonable' when viewed in the context of real property returns:


Above table is updated to December, showing that high inflationary pressures in places like Tokyo and London is destroying returns on rentals, whilst both SZ and HK sit reasonably happy in positive territory near the top of the pile. Generally high real return markets are more sustainable pricewise than -ve yielding ones.

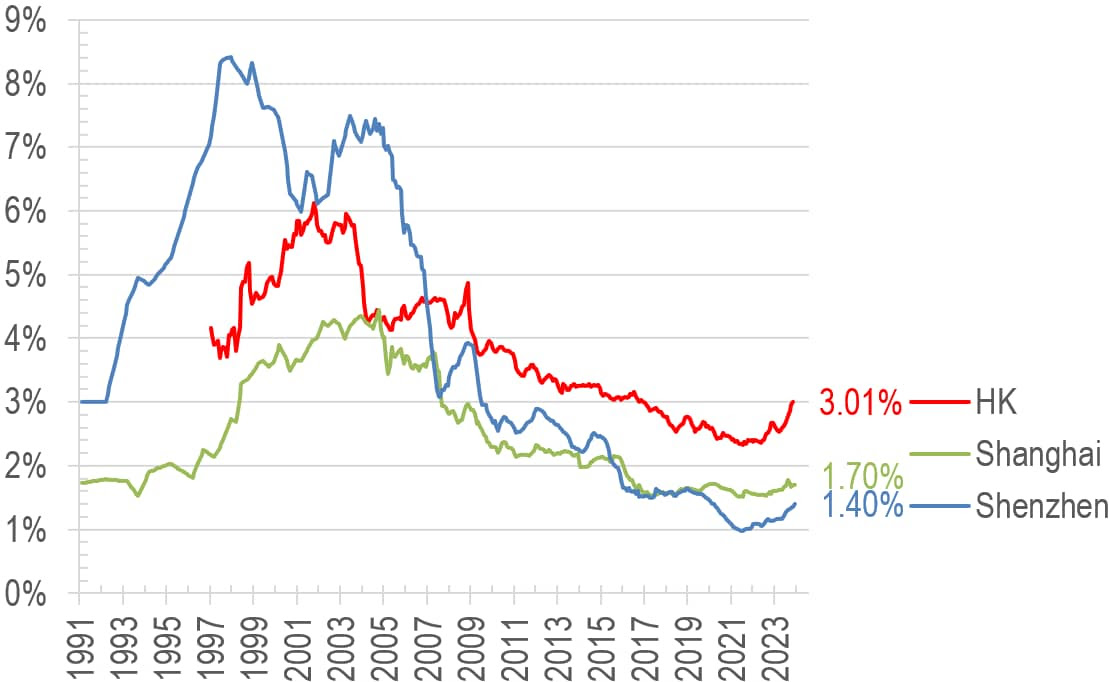
The higher nominal yield in HK (3%) also means that the higher interest rates here in the longer term will make for a healthier market when SZ's paltry 1.4%:

rental yield

7) final technical look - SZ might do better medium term?

On a long term technical perspective, SZ could continue to play catch up, but we await price action to give the next signal (either pierces the green support or breaks out of the blue resistance) before jumping into investment action. The answer might show itself by as early as mid-2024:

SZ vs HK price ratios

Given various headwinds in primarily geopolitics, perhaps investors are best to diversify into commodities and low conflict risk jurisdictions, exactly what we have been doing for the past 2-3 years...


==================Article 1==================

Hong Kong vs Shenzhen: a day of food, drinks, sightseeing and leisure compared – how much cheaper can the mainland Chinese city be?

The recent jump in people heading from Hong Kong to Shenzhen at the weekend suggests you can enjoy a lot more for much less in the mainland Chinese city...

https://www.scmp.com/lifestyle/travel-leisure/article/3250410/hong-kong-vs-shenzhen-day-food-drinks-sightseeing-and-leisure-compared-how-much-cheaper-can-mainland

==================Article 2==================

Facilitation measures on two-way flow of high-end talents within the GBA

The Hong Kong Special Administrative Region Government and Mainland authorities have been exploring means to further facilitate the two-way flow of talents within the GBA, including “northbound” flow of non-Chinese Hong Kong residents....

https://www.info.gov.hk/gia/general/202401/24/P2024012400464.htm

==================Article 3==================

China cuts 5-year mortgage rate by record margin to aid property sector

The People's Bank of China lowered the five-year rate to 3.95%, from 4.2%, marking the first reduction since last June...

https://asia.nikkei.com/Economy/China-cuts-5-year-mortgage-rate-by-record-margin-to-aid-property-sector

==================Article 4==================

消息指中央同意擴大自由行來港 有議員料納入更多二三線城市

現僅49個城市居民可自由行來港 部份省份無份

原文網址:

https://www.hk01.com/article/993035

English Google translate here.

2023年8月4日星期五

Too much policy meddling trashes HK housing market 20230804

The SAR government’s launches of new housing policies have reached fever pitch in recent years: from Chief Executive Lee’s “Light Public Housing (LPH)” initiative from his 2022 Policy Address to this year’s resumption of “Private Sector Participation Scheme (PSPS)” that was abandoned in 2002, to the launch of Transitional Housing (TH)… All this begs the question of whether the government has a well laid plan for the long term, or just reacting furiously to show it is doing something to the rising home prices (which has now turned down)?

The stronger the price rises, the bigger the temptation to interfere

Your correspondent has charted all the major public housing initiatives of the past 60 years so as to demonstrate cause and effect, and to illustrate the motives and timing of their launches. The result is clear: whenever major tinkering is made to housing policies, it is often after sharp surges (see brown arrows in Chart 1) or falls (green arrows) in home prices, for example:

a)      The introduction in 1977 of the Home Ownership Scheme (HOS) / PSPS (brown arrow A) was after some 133% rise in home prices between 1971 and 1976 (see dotted line 1 on the property price line); this was followed by

b)      The Middle Income Housing launch in 1980 coinciding with the end of another period of strong price increases (dotted line 2), but then hastily cancelled in 1984 (green arrow B) when the upcycle turned downwards after a final surge towards the 1981 peak (dotted line 3); likewise,

Chart 1: A timeline of Hong Kong’s major public housing schemes changes

a)      The continued home price surge between 1985 and 1994, catalysed several further housing schemes (Home Purchase Loan Scheme, Sandwich Class Housing, see brown arrows C-D), as well as the final blast to mark the peak: the Tenants Purchase Scheme, Buy or Rent Option, and even Mortgage Subsidy (arrow E), all launched before the bubble burst in 1997 (dotted line 5);

d)      It was only after the 70% the collapse in home prices around the SARS bottom that the government hurriedly withdrew as many as five housing interventions (green arrow F)!

New up cycles, new intervention temptations

Since the 2003 lows, the return of a housing upcycle (dotted lines 6+7) yet again lured the authorities to launch several rounds of new measures in an attempt to be seen as ‘doing something about affordability’, these included My Home Purchase and the so called ‘practical but not extravagant’ new variety of HOS  (brown arrows G+H)… go figure the multitude of nuances in all these fancy layers of welfare!

Sadly for the mandarins in charge, the global zero interest rate environment pushed property prices to even loftier heights, to finally reach a triple top in 2019-2022. This unacceptable situation had to be stopped, so in a flurry of new initiatives, we saw Green Form HOS, White Form Secondary Market, followed by LPH/ Private Sales Subsidised Sale Flat Pilot Scheme/TH amongst others (brown arrow I). All this illustrates is how confusing and short-sighted our housing policy has been, with disappointing absence of logical philosophy on housing welfare provision.

Recent months, the increasing intensity and proliferation of initiatives echoes the same panic last saw in the 1997 peak, presaging that another major top may be in place for this cycle (cf arrow E vs arrow I): at the time of writing, prices have fallen by 12% from the September 2021 highs. Your correspondent fears that in another year or two, there may be a repeat of policy U turns saw at the last major bottom (ie green arrow F vs arrow J)…

In order to illustrate the point on this predictable cycle, we plotted the cause of policy actions (i.e. private home prices, see the blue line in Chart 2) against the symptoms as expressed through the political pressure (quantified by say the PRH waiting time, see green line), and then the result being the number of government interventions (red line). There is an eery correlation of the three:

Chart 2: Home prices leads PRH waiting time, which impacts the intensity of government’s meddling in the housing market

The general pattern seems to be that the number of public housing schemes (i.e. the frequency of market interventions) fluctuates with the length of PRH waiting time; and the latter reflects of the swing between greed and fear as property price fluctuates. The blue line in Chart 2, being a lead indicator, suggests that as the decline in property prices continues, average waiting time will also recede, to be followed by the phasing out of various government schemes around 2025-7 (ie red line will turn down too).

What the above chart also suggests is that government policies are always too little too late, what the various recent interventions/initiatives are already 3-4 years too late, and the drop in home prices will mean that these policies are yet again pro-cyclical, ie increasing price/demand volatility rather than solving the root cause of the problem.

Simple is beautiful – learn from Shenzhen?

Hong Kong’s housing welfare policy/administration has long been held hostage by various vested interest groups, leading to endless proliferation of conflicting policies which only complicate and confuse the people. But across the Shenzhen River, our neighbour has a much simpler public housing set up, with only three layers and minimal overlap with the private market. This enables much more focused welfare delivery with less wastage – a real breath of fresh air indeed:

Chart 3: A timeline of Shenzhen’s major public housing schemes changes

Even though housing policies in Shenzhen seem to be driven strong property price moves just like in Hong Kong (see arrows a-c), but changes to old schemes are accompanied by abolition of obsolete schemes that no longer work. This is strong contrast to the dazzling array of overlapping complexities that typify Hong Kong’s set up.

As a further example, Shenzhen plans to supply/allocate 80,000 welfare housing units (c. 4 million square metres in gross floor area) and 60,000 private units (c. 6 million square meters) in 2023. This translates to a public : private unit and floor area ratio of 4:3 and 4:6 respectively; compared with Hong Kong's overkill target ratio of 7:3, Shenzhen appears to have a freer housing market!

Policy back to basics: abolish HOS, reduce PRH

Since 1965, Hong Kong has launched a total of 18 public housing schemes, of which 10 are still in force (Chart 1), but the housing problem has only worsened. Not only has public housing policy been widely criticised for exacerbating housing shortage, but has had the adverse effect of HOS breeding more of the “poor” and the “lazy”; this is detrimental to social mobility, but also wastes vast amounts of social and monetary resources.

In view of this quagmire, the government should radically reform as soon as possible:

a)      to make available all HOS stock to the private market, this will immediately enlarge supply and can rapidly bring property prices back to more affordable levels; and

b)      limit scope of PRH to the most needy, vulnerable group in society (rather than the current 35% of all population!); by releasing land to the private leasing market, even the high rents we see now stand a chance of moderating, thus lessening the pressure on the government to engage in counterproductive market interference.

Chart 4: existing housing benefits a sore sight of complete mess


Chart 5: rationalised housing benefits led by private sector removes need for intervention 

If only the government would allow the invisible hand to allocate supply/demand and prices in housing like so many other commodities are permitted to, then the reason for the existence of such a mess and policy nightmare as shown in Chart 4 vanishes. When returned back to basics, the government’s role will shrink to operating a basic safety net (red area in Chart 5) of physical shelter provision, and perhaps as a transition into the private market, a limited extension into rental vouchers but limited to say 10% of population. This way, even the voucher recipients get freedom of choice in finding the right homes in the right districts, and at the right prices according to the welfare beneficiary. Such an elegant solution will also forever eliminate the endless expansion of bureaucracies, sluggish liquidity/mobility in the housing market, and of course the constant exploitation of an unfair welfare system – a blessing for Hong Kong from every angle one views.

A truly flexible, effective and fair proportion of housing provision by the public sector should be as low as possible, and by no means the 7:3 ratio under current policies (as indicated by the red arrow in Chart 6), by providing low-level safety net physical housing (green arrow) coupled with monetary subsidy for the next poorest group. If Hong Kong continues to imitate badly what Singapore does for its own specific social political reasons, it will only be further left in the dust by a younger, more dynamic neighbour in Shenzhen!

Chart 6: The proportion of public housing is surging again, bad news for future freedom of Hongkongers…

For a revision of some of your correspondent’s past analyses on Hong Kong’s housing welfare, here are the links to recent publications for your reference:

HK’s Ever Ballooning Public Housing Addiction Cycle 11/2021 (Web, Blog, LinkedIn)

as well as some earlier writings in Chinese:

居屋政策 好心做壞事 20147English Google translation (Web, Blog)

公屋改革面面觀租金偏離市場20149English Google translation (Web, Blog)

公屋改革面面觀結構性自我膨脹 20149English Google translation (Web, Blog)

公屋改革面面觀公屋「豪宅化」201410English Google translation (Blog)


The author would like to thank Alice Yurong Zeng from the Chinese University of Hong Kong majoring in International Business and Chinese Enterprise for assisting in data collection, analysis, and drafting this article.