顯示包含「F&B」標籤的文章。顯示所有文章

2024年8月15日星期四

Is the F&B trade oversupplied in HK? 20240815

Lately we often hear how bad the retail scene in HK has become, and indeed a stroll down main thoroughfares around town reveals just how many boarded up vacant shops there are, even in formerly very busy precincts. So how bad has the food and beverage (F&B) landscape been? We take a look at how the numbers and make up of licences in the industry to pin down any emerging trends…

What surprises us initially is how the total number of licences have continued to increase in HK despite the severe lockdowns and the current weak economic performance – at end-2023 there were 33,536 outlets in the city, up a substantial 19% against pre-lockdown 2019:

Chart 1: No. of licences over time, and restaurant receipt changes (grey area)


Chart 2: No. of licences – Others sub category

In fact, neither the social unrest nor the lockdowns made any dent in the over army of F&B outlets in HK, whose numbers have basically increased non stop for the past quarter of a century!

Top winners have much to thank harsh lockdown policies

Because of the combined adverse events of the unrest and lockdowns, it is very appropriate to compare numbers against 2019 levels. Amongst the various categories of F&B licences, three strong winners stick out, and they are all beneficiaries of isolation/curfew/lockdown related policies that ruled the ‘covid years’:

a) Cold stores – as lockdowns and work from home (WFH) took grip, more and more people opted to take away and cook at home in the period 2020-22, resulting in a massive 41% spike in outlets that sell refrigerated foodstuffs (red bar, Chart 2);

b) Food factories – along the same vein, food factories swelled by 34% thanks to people buying more ready to serve/cook meals instead of dining in (orange bar, Chart 1);

c) Fresh provision shops – trying to eat healthy and cooking at home (as strict lockdowns prevented dining out) made this type of outlet popular, which as a result rose by 29% in the past 4 years (dark green bar, Chart 1).

Social distancing killed the sweet tooth!

The most unexpected losers in this changed dynamic was how commuters disappeared and with that bakers (presumably people bought their buns en route to work before), which were down 14% (light blue bar, Chart 1), followed by frozen confection entities, may be because there were no birthday parties or office outings, or other celebrations (purple bar, Chart 1).

Viewed in proportional terms, here is a graphic illustration of how each component of the F&B industry fared in the past few years (red arrows = expanded, blue arrows = shrank):

Chart 3: Relative weighting of F&B categories over time 

One driver of the rise in food factory category was also due to how consumers have felt poorer in the intervening years, resulting the sudden popularisation of the so called ‘Rice with Two Sides’ outlets, which mushroomed everywhere, and selling each lunchbox set for as low as $25; if you felt like pampering yourself, you might splash out and bought ‘Rice with Three Sides’ for $35!

Retail rent cannot be willed into rising despite the economy

It is easy to blame the landlords for ‘unconscionably’ high rents and coldblooded disregard for retail livelihoods, as is often heard on the media. However, just looking at how restaurant receipts have changed and how sympathetically retail rents have tracked it, one can only say that rents are very much a product of the market – if tenants can’t make money, then so can’t the landlords:

Chart 4:  Retail rent index actually underperformed restaurant receipts in the past 18 years  

In fact the total F&B receipt index is up 94% since 2005, but retail rents over the same period was up a more measly 75%...

So, if rents are not the culprit of the current F&B malaise, then what is the real problem? We hypothesise that it may be the combined effect of lack of innovation and moving up the value chain, and the southbound invasion by cheap and competitive mainland brands:

Chart 5: Retail rent index vs Restaurant receipt index  

What is clear in the chart above is that despite rising nominal receipts (red line) in the past two decades, the real income has stagnated for most of that period – with no rise at all since about 2008 (green line), then the social unrests and lockdowns became the final straw that broke the camel’s back, taking the real returns for the industry as a whole from 150 to 120 now (ie a 20% decline).

What is more alarming is how the total number of outlets continued to grow despite the savage lockdowns – the licence numbers have basically grown uninterrupted during the whole of the lockdown years (blue line). As a result, the per outlet revenue has fallen a more dramatic 30% from the mid 2018 highs to 818 now. 

Perhaps there are mix issues obscuring the numbers – for example more smaller eateries have surfaced while the industry wide capacity is reduced by larger restaurants going out of business (such as whole-floor Chinese dim sum restaurants), not to mention more licences being out of retail premises and residing in industrial properties in the form of factory kitchens. What is certain is that there is a huge amount of recovery yet to take place in HK’s F&B arena before we are genuinely ‘back in business’.

The author would like to thank Huang Ying Fung from Hong Kong University of Science and Technology majoring in Accounting and Finance for assisting in data collection, analysis, and drafting this article.


2024年3月22日星期五

Barbarians at the gates – will mainland eateries flood HK’s F&B scene? 20240322


One of the hottest topics in dinner conversations of late has been Hongkongers shopping or even spending weekends in Shenzhen, even major media channels are reporting the phenomenon (eg. in SCMP and NYT). The scale of the outbound outpouring is not restricted to just Guangdong of course, given how locked down HK has been during 2020-2023, and how strong the HKD has risen against other currencies of late.

This thirst for new and affordable cuisines and services should not have escaped the attention of any ambitious PRC brands – in fact the southbound march has begun in earnest already (as seen in this Singtao piece). We have found some examples of recent PRC brands opening here:

Figure 1: MuWu BBQ

Figure 2: HeFu Noodle


Figure 3: Tai Er Pickled Veg Fish


Figure 4: Tan Yu 


So how big are the potential inroads these Mainland brands can make in HK? We start by looking at a Top 100 PRC Restaurants for 2023, which covers some 219,000 outlets nationally to assess likely impact of shop openings in HK. The top 30 names from the list is shown here alongside their scores and franchise sizes:

Table 1: Top 100 PRC food & beverage brands and their cuisines


Charting food preferences in China

By analysing the breakdown of the top F&B chains into their cuisine and types of foodstuffs, we are able to peer into the modern taste of the Chinese urban population at large.

First, by cuisine, Sichuan cooking has the highest number of chains operating across China (16 of them, followed by beverage brands at 13, see blue bars below):

Chart 1: Top 100 PRC brands/outlets by cuisine 

Sichuan cooking is also the 3rd highest cuisine by number of outlets (orange marks above), closely following beverages at #1 and American at #2.

Together, almost 30% of Top 100 PRC F&B outlets offer Sichuan and Guangdong cuisines. Most surprisingly however, of the 23 cuisines charted above, Shandong and Jiangsu ranked #23 and #19 respectively despite their reputation as part of the ‘eight major cuisines of China’!

Made to order & fast food dominate food types

When it comes to type of foods, it is unsurprising to see people wanting their individual tastes catered for, resulting in cook-to-order (also known as 小菜) chains ranking first by brands (1st blue bar below). We think this more labour intensive way of catering should be dominated mostly by smaller chains in the list, not to mention millions more even smaller eateries not in the top-100 list.

The next biggest entries are all easy to cater, volume business type foodstuffs, such as hotpot, beverages, fastfood, burger, pizza, and the like:

Chart 2: Top 100 PRC brands/outlets by food type – mostly fastfood varieties 

Also unsurprising is how these fastfood outlets – handshake beverage, Chinese fast food, fried chicken, Chinese braised meat (or 滷味) – given the economies of scale due to fast turnover and large volumes came high in the ranking of number of outlets (orange marks above).

Why is Guangdong cuisine so underrepresented?

Despite the freshness, high creativity, and widespread availability around the world, it was surprising for us to note that Guangdong cooking was probably the most underrepresented cuisine in the top-100 list:

Chart 3: Brand % vs outlets % - high penetration from fastfood vs low presence from Guangdong 

In fact, as is clear from the chart above, Guangdong cuisine is the furthest away from trend in relative proportion of branches as well as outlets. This unexpected pattern might be explained by the need to have fresh ingredients many of which from warm climate, and proliferation of seafood dishes which call for proximity to the ocean, and possibility of the more skilled preparations required (eg more frying rather than braising) which limits the availability of proficient cooks being available to staff the kitchens…

Drinks and mass fast food items dominate market shares

In the food type domain, the same factors are at work in deciding which type is abundantly supplied (fastfood category food, see blue labels below) compared to those serving cook to order food (red label) where complexities in diners’ orders results in a smaller number of brands operating but is compensated by higher number of outlets (in fact the highest category by food type):

Chart 4: Brand % vs outlet % - Food Items 


How do Shenzhen and Shanghai measure vs national average?

We next look at how brands enter top cities (we chose Shanghai and Shenzhen) to gauge how each city has its own appetite, as well as if opportunities exist for under served cuisines in these cities.

It is interesting to note that in Shanghai, the over populated brands (red names below) appear to be dominated by listed companies from HK and benefited from easy access to capital market for their expansion plans. On the other hand, the underpenetrated brands tend to be regional brands which may have a lower mind share or ‘prestige’, thus explaining their under penetration in Shanghai (ie population implied outlet numbers are much higher than actual outlets, eg. Shuyi and CHAGEE):

Chart 5: SH - population implied outlets vs actual outlets

The pattern is even more interesting in Shenzhen – the one phenomenon that stands out here is how the city is highly penetrated by local brands and cuisines – Hakka and Guangzhou already point to the geographical proximity of their cuisines, while ZhenGongFu and Muwu are both locally grown brands:

Chart 6: SZ – population implied outlet numbers vs actual


HK to see a torrent of new entrants yet

Set aside the fact that HK may be at equilibrium in its number of F&B outlets, the large number of PRC hopefuls to establish a bridge head here, or simply to use HK as a marketing medium given its international status, should suggest that a large number of the top F&B brands in China will continue to come this way.

So how do we estimate the likely inflows? With Hong Kong and Shanghai both being gateway cities, it may well be a good proxy to use the Shanghai F&B population as a proxy of likely concentration of eateries present there already but not yet entered HK yet. Below is the result of our projections:

Chart 7: SH population implied outlets vs actual numbers in HK

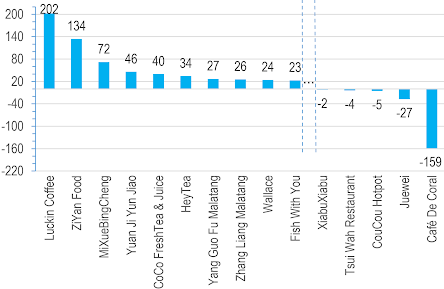
Funnily, the Shanghai concentrations suggest that Café De Coral is over populated in HK, and could be in need of some trimming in numbers. However in its place there are dozens of just the top-100 brands that will want to open up here, as shown by the whole bank of orange marks on the left. All of them, given their own concentration in Shanghai already, should mean hundreds of new arrivals in HK in the months and years ahead – the thinner arrow above suggests each brand with >10 outlets, and those behind the fatter arrow suggests single digit openings.

Applying the SH mix to HK, here is a league table of top brands that need to open shop here:

Chart 8: HK brand potential – most likely entrants and leavers charted 

The results are an incredible number of new beverage outlets to come, at roughly 300 stores from the above chart! Factors outside the above quantitative analysis however must be factored in when making predictions, for example, how heavily penetrated are local HK coffee shops already – you can hardly not bump into specialty barista cafes anywhere you go these days, have they already filled the gap of the Luckins of the world? What about the local traditional herbal tea brands that may reduce demand for mass PRC milk tea offerings like HeyTea?

On the flip side of likely inflows, we may have an oversupply of brands in HK such as Juewei which specialises in duck necks (?!), and local champions like Café de Coral may also see leakage of its traditional customer base as the HK product mix enriches with new entrants…

Retail demand from new entrants – not material

So how will this new onslaught of new brand openings in HK bring in terms of new retail floor space demand? Our modelling suggests some 0.55m square feet of new entrants from the top 100 brands, which when benchmarked against HK’s retail stock at 130m square feet, is but a rounding error – or a mere 0.45% boost. It is exciting nevertheless as a consumer to see new offerings which increases shopper choices and introduces new ways of eating/drinking which can only enhance HK’s reputation as a ‘paradise of food’ even further…


The author would like to thank Yeung Ching Wa Oscar from City University of Hong Kong majoring in Finance for assisting in data collection and analysis of this article.