顯示包含「housing」標籤的文章。顯示所有文章

2023年4月11日星期二

Follow Up on Tax-Friendly States in US 20230411

near perfect match to our previous study on home price vs tax...


we noted Florida, Tennesse, Nevada and Texas being the most attractive states, while New York, Massachusetts, Maryland and Virginia were the least favourable places to live + invest - data from US Census Bureau has proven the same conclusion 

follow the money is always a good guide in investing, and in this case, money in the pockets of the people, not in the claws of the bureaucrats/politicians!


reference to original post below:

Which US states are tax friendly… and cheap?

https://yulun2012.blogspot.com/2022/09/which-us-states-are-tax-friendly-and.html


https://www.databymy.com/post/where-are-people-moving-to-in-the-us-what-is-the-best-state-to-move-to


2022年11月9日星期三

Bloomberg Talk - How Rate Hikes & Inflation Could Impact the Property Market in 2023

I would like to thank Bloomberg for the invitation to be on the panel on November 8, 2022. At the event, I highlighted the impact of rate hikes & inflation on global housing markets and discussed the opportunities that may lie ahead.

Below is a short extract of some salient points in the presentation.


Event overview:

Aggressive interest-rate hikes could worsen the outlook for global housing markets, particularly Hong Kong, which might continue to follow the U.S. in lifting mortgage rates aggressively until mid-2023. The Hong Kong housing market 2023 outlook versus other major markets like the UK and Singapore will be discussed, and explore if commercial and industrial properties could be an inflation hedge and outperform home prices in Hong Kong.

2022年10月31日星期一

Is bear market confirmed for HK? 20221031

The observation that HK housing is in a downcycle has become consensus of late, after the CCL reaches a new low last week from the triple top dating as far back as 2019 (see green line in Chart 1). Cumulatively the index is now down 12% from the Aug 2021 high:

Chart 1: Home prices denominated in various currencies

But across the world, investors will always think about returns in their own currencies, and therefore, an 'objective consensus' of a true bear market in any asset price is only formed when the bulk of observers around the world see the same down trend that the base currency investors also sees.

So in order to find out whether the HK home prices are truly in a bear market by consensus (Chart 1 does not seem to suggest that is the case), let's take a look at the index as denominated in a few main jurisdictions:

a) the collective non-USD community (as proxied by DXY);

b) the EU community (as proxied by Euro);

c) the Brits (as proxied by GBP); and

d) gold bugs (as proxied by the price of gold).

HK still in bull market to world at large

From the point of view of the developed world population (as the USD index is represented by six liquid currencies, see Chart 3), however, the drop in HKD (blue line in Chart 2) terms is not corroborated by the price as measured by DXY the USD index:

Chart 2: Home price in non-USD terms still trending up

In fact, the non-USD price index is still very much heading up, from the longer term view (green dotted lines) to medium term view (red dotted lines), to even the shorter term time horizon (blue dotted lines)! What this suggests is that for the average OECD investor, HK property is still a rising asset.


Chart 3: make up of the DXY - 6 currencies

Home prices even more bullish for Europeans

For the average person based in Euro, the upward momentum seems even stronger compared to DXY, and HK prices, thanks to the collapse in Euros in the last few months, seem to be accelerating upwards within the red channel:

Chart 4: Euro investors may see HK prices accelerating upwards

Brits also feel the upturn?

Similarly, with the recent precipitous drop in the value of the Pound, the HK home price index will appear to the average Blighty investor to be positively surging even, after HK first started pulling away from a very correlated pairing between the HKD and GBP denominated indices which pretty much shadowed each other since our data started in 1981:

Chart 5: HK prices look strong to the British Pound investor

The much weaker pound post Boris's premiership (botched Brexit plus zealous lockdowns?) ensures that the weak pound has provided a strong platform for HK assets to appear to go from strength to strength.

Gold the only currency beating HK property?

For those who believe in gold, there is good news - In Gold terms, the 1997 peak remains the unsurprised top for HK home prices, meaning that we may still be in a bear market when measured from the perspective of the precious metal:

Chart 6: Gold strong vs HK, but mini breakout underway?

Even though the price index has broken above a near term trading channel, as indicated by the red arrow in Chart 6, if war does flare up more next year, we think gold might reassert its dominance and the break up could reverse. Time will tell.

Strong currency imports deflation, which is not a bad thing now!

In normal disinflationary times such as most of the past 40+ years, being pegged to the USD is good for HK assets during times of weak USD, as Chart 7 illustrates - weakening or weak USD is generally accompanied by bouts of strong home price increases, and the reverse held true (mostly in the mid/late 90s):

Chart 7: weak USD good for home prices, and vice versa - will it be different this time?

However, could we be in a period similar to the early 70s or early 80s, when strong USD will suck liquidity away from HK and produce deflation? How does this contrast the current super high inflationary environment? Is the strong USD a blessing as it reduces the 'cost of living' crisis that would otherwise hit these shores?

A very interesting dynamic, not seen before in our brief monetary history for sure... The above study shows that, whilst we remain somewhat bearish on the outlook of the HK market, more needs to happen in the global currency markets before it is a true foregone conclusion...


The author would like to thank Lee Man Hin Carson from The University of Hong Kong majoring in Accounting and Finance for assisting in data collection, analysis, and drafting of this article.

2022年10月19日星期三

2022 HK policy address speech - Pro property and pro industrial 20221019

Key points of the policy speech are as follows:

a) all out attracting talent to HK - a must do given the loss of 140k population in the past 2-3 years, this is contained in divider a) below;

b) more drive for family office hub as well as other small measures of business support see divider b);

c) housing bad policy continues - i) plundering private market share with every rising PRH/HOS supply, resulting in every higher private home prices and ever more public housing slaves - what a missed opportunity! ii) displacing brownfields into new built industrial - likely insufficient vs demand; iii) private supply low, but development process shortening. see divider c);

d) major speeding up of infrastructure build out - mostly roads and rails, very positive and lots of opportunities opening up for the smart property investor see divider d).

In summary - talent will not come unless we lift the lockdowns, but otherwise by and large a pro property speech with lots of bright spots, but sadly will not help affordability of housing, which is unsurprising given how entrenched the public-housing vested interest groups is!

below are extracts of the speech, emphasis are mine, with odd comments thrown in:

-----------------------------------------------------a) Talent------------------------------------------------------------

Attract Enterprises, Investment and Talents to Enhance Competitiveness

26. …new institutional setups and implement an array of new initiatives targeted at attracting enterprises, investment and talents:

establish the Office for Attracting Strategic Enterprises (OASES), led by the Financial Secretary, for attracting strategic enterprises …offering them special facilitation measures and one-stop services;

establish the Talents Service Unit, led by the Chief Secretary…formulating strategies to recruit talents;

set up Dedicated Teams for Attracting Businesses and Talents …reach out to target enterprises and talents and persuade them to pursue development in Hong Kong;

set aside $30 billion from the Future Fund to establish the Co-Investment Fund for attracting enterprises to set up operations in Hong Kong and investing in their business;

launch the Top Talent Pass Scheme;

enhance existing talent admission schemes; and

upon becoming permanent residents, apply for a refund of the extra stamp duty paid for purchasing residential property in Hong Kong.

27. The OASES will:

1. draw up a list of target enterprises …to reach out to and carry out negotiations with the enterprises;

2. measures covering aspects such as land, tax and financing that are applicable exclusively to target enterprises, and …tailor-made plans to facilitate the setting up in Hong Kong; and

3. provide the employees …one-stop facilitation services in areas such as visa application and education arrangement for their children.

Trawl for Talents

29. Over the past two years, the local workforce shrank by about 140 000. … We will:

1. launch the Top Talent Pass Scheme for a period of two years. Eligible talents will include individuals whose annual salary reached HK$2.5 million or above in the past year, and individuals graduated from the world's top 100 universities with at least three years of work experience over the past five years. …two-year pass …not subject to any quota. Individuals who graduated from the world's top 100 universities in the past five years and have yet to fulfil the work experience requirement will also be eligible, subject to an annual quota of 10 000;

2. streamline the General Employment Policy (GEP) and the Admission Scheme for Mainland Talents and Professionals (ASMTP), vacancies under the 13 professions in the Talent List with annual salary of HK$2 million or above, employers are not required to provide proof to substantiate their difficulties in local recruitment;

3. suspend the annual quota under the Quality Migrant Admission Scheme (QMAS) for a period of two years;

4. relax the Immigration Arrangements for Non-local Graduates (IANG) by extending the limit of stay from one year to two years …expand to cover the GBA campus of a Hong Kong university on a pilot basis for a period of two years.

5. enhance the Technology Talent Admission Scheme (TechTAS) by lifting the requirement for technology firms to employ additional local employees;

6. extend the limit of stay of employment visas … will be valid for a maximum period of three years; and

7. refund the extra stamp duty …become a permanent resident …can apply for a refund of the Buyer's Stamp Duty and the New Residential Stamp Duty paid for the first residential property purchased which they still own, while the Ad Valorem Stamp Duty at Scale 2 rates is still payable such that the overall stamp duty charged will be on par with that charged on first-time home buyers who are ordinary permanent residents.

30. waive the requirement of applying for an employment visa for more visitors participating in short-term activities in Hong Kong. …will expanding to more categories.

---------------------------------------------------b) Business Freebies--------------------------------------------

International Financial Centre

37. …strengthen asset and risk management – …to offer tax concession for eligible family offices. The target is attracting no less than 200 family offices to establish or expand their operations in Hong Kong by end-2025.

45. support the convention and exhibition (C&E) industry …new $1.4 billion scheme …to subsidise more than 200 exhibitions to be staged in Hong Kong over three years.

46. To provide further support for SMEs, we will:

extend concessions of government fees and charges –reduce 75% of water and sewage charges for non-domestic accounts for eight months from 1 December 2022 to 31 July 2023, subject to a monthly ceiling of $20,000 and $12,500 respectively per household. …provide 75% rental or fee concessions …tenants of government premises and eligible short-term tenancies and waivers under the Lands Department for six months from 1 January 2023 to 30 June 2023.

----------------------------------------c) Housing Madness Continues-----------------------------------------

63. The Steering Committee on Land and Housing Supply and the Task Force on Public Housing Projects …submitted …reports. set the following key strategies and targets:

1. introduce the new Light Public Housing (LPH), with about 30 000 units to be built in the coming five years; [ed: only bureaucrats know how to create more complex structures over already bewildering complicated infrastructure]

2. increase public housing production by about 50% in the coming five years (from 2023-24 to 2027-28);

3. cap the waiting time for PRH immediately. …6 years and shorten it to about 4.5 years in four years' time (i.e. in 2026-27);

4. saleable area of all subsidised sale flats completed from 2026-27 onward will be no less than 26 square metres [ed: public housing becoming ever more luxurious and ever larger – no longer a safety net];

Private Housing Supply

66. …the demand for private housing in the next 10 years will be 129 000 units. …providing no less than 72 000 residential units in the next five years. [ed: private ownership is now an after thought in the bureaucratic housing steam roller]

69. …plan to make available land in Yuen Long and Hung Shui Kiu for development of multi-storey industrial buildings from next year, with lease conditions requiring a certain portion of floor area to be set aside for leasing to the affected brownfield operators below market rent.[ed: supply will be much less than displaced brown field site GFA by far, good for industrial property]

70. Tseung Kwan O (TKO) Area …provide 50 000 residential units with the first population intake in 2030 at the earliest. [ed: not a pleasant district – ultra high density dormitory town]

71. To substantially compress the time required for land production, we will:

1. streamline statutory procedures – …bill to amend the Town Planning Ordinance, the Land Resumption Ordinance, the Foreshore and Sea-bed (Reclamations) Ordinance, the Roads (Works, Use and Compensation) Ordinance and the Railways Ordinance, as well as amendment to the Schedules to the EIA Ordinance …the time required …reduced from at least 6 years to 4 years, …large-scale projects from 13 years to 7 years, of which the time for the EIA process will be compressed to within 18 to 24 months;

2. …charging land premium at standard rates for redevelopment of industrial buildings. …extend this approach, [from] only industrial buildings and in-situ land exchange applications in NDAs, to cover agricultural land in the New Territories located outside NDAs to compress relevant workflow; [ed: will speed up industrial revitalisation speed]

3. …lowering the compulsory sale application thresholds for private buildings aged 50 or above but below 70 from 80% to 70% of ownership, and further to 60% for those aged 70 or above. For industrial buildings in non-industrial zoning, the threshold will be lowered to 70% of ownership for those aged 30 years or above; [ed: great for industrial, bad for minority private ownership rights]

----------------------------------------------------d) Infra Galore-----------------------------------------------------

Drive Development by Transport Infrastructure

76. The six major transport infrastructure projects are:

1. Northern Metropolis Highway – It will facilitate east-west connectivity in the New Territories North between Tin Shui Wai in the west and Kwu Tung North in the east via San Tin;

2. Shatin Bypass – connecting Tai Po and Kowloon West …relieve traffic pressure on Tolo Highway;

3. TKO-Yau Tong Tunnel – …third road tunnel at TKO [for] TKO Area 137;

4. Hong Kong-Shenzhen Western Rail Link – Hung Shui Kiu with Qianhai [ed: long shelved but now back on track];

5. Central Rail Link – …12th railway line will connect Kam Tin in Yuen Long with Kowloon Tong via Kwai Chung, alleviating pressure on the carrying capacity of the Tuen Ma Line; and

6. TKO Line Southern Extension –TKO Line southwards to TKO Area 137,.

77. …Kwu Tung Station of the Northern Link will be commissioned in 2027, …the Tung Chung Line Extension, Oyster Bay Station and Tuen Mun South Extension commencing next year.

78. …projects under planning, including Route 11, Tsing Yi-Lantau Link and Tuen Mun Bypass, as well as improvements to Lion Rock Tunnel. 

2022年9月30日星期五

Which US states are tax friendly… and cheap? 20220930

 As interest rates spike and cost of living crises bite across the world, it is even more important now to choose one’s investment (or living) destinations carefully. On top of the usual comparisons of tax rates between jurisdictions (see earlier article “LowerUS State Tax Drives Population Inflows, Home Price Rises”), this article employs a slightly different angle – the composition of tax takes between host governments. We undertake this exercise using Tax Foundations’ data which breaks down state tax income by four main components: corporate income tax, individual income tax, sales tax, and property tax.


Preferring low income tax and fair individual-corporate balance

For most income earning job holders who may also be home owners, it may be reasonable to assume that they prefer paying lower income tax. On top of that we would also assume that when individuals are paying similar (or lower) levels of tax compared to companies, the smaller guy (individual) would be getting more fairly treated or allowed more individual liberty.

One way to quantify these preferences is to plot these preferences on a scattergram using two measurements:

  1. Higher sales tax take vs income tax – meaning more of the government’s income comes from consumption rather than savings, thus encouraging investment for longer term if not implying low absolute income tax rates, this is captured below on the X-axis;
  2. Lower individuals tax than corporates – put another way, this state of affairs results either when there is a booming corporate sector (leading to higher corporate income taxes) or when the resident individuals get to keep more of their salaries/profits instead of just the big corporates being able to do that (as they have the clout/resources to negotiate/threaten govts into large tax concessions) – this metric is captured on the Y-axis:

Chart 1: higher sales & corporate tax takes vs individual taxes are ‘good’, and vice versa

The spread of the scatter is surprisingly linear, and we have highlighted the ‘desirable’ end of the spectrum in red – states that fall into this category include: Texas, Wyoming, Nevada, Washington, South Dakota, Tennessee, Florida, Alaska and New Hampshire.

On the other extreme (the high individual tax states) we have these ‘bad’ states in purple: Oregon, Maryland, Massachusetts, and Delaware, Virginia, and New York.


States with low income tax AND low property tax

For property investors, lower property tax burden is also an important consideration, so this is what we did next - bombining the two metrics from last section into one (now represented by % sales tax + % corporate tax - % individual tax x 2), and then comparing the result to the proportion of state tax income from property. The results are shown in the chart below:

Chart 2: winners from last section which are also low property tax states – represented by red text in orange shade

The results are interesting – the number of states that meet both low income tax and low property tax criteria now falls, with Tennessee, Nevada, Washington, South Dakota, now the remaining front runners and Florida just scraping in. A new entry however has popped up in the form of New Mexico (represented as N.M. above), which has one of the lowest property taxes (plus great weather) so may well be a good choice too for investors who are not earning a big income? On the opposite end of the spectrum (unfavourable individual tax states), Delaware has lower property tax burdens also, but probably not ideal for the average middle class property owner given its reputation of being a corporate tax haven… the other regulars which score badly on both fronts are Oregon, MA, and Montana.


Internal migration proves thesis right

To prove our hypothesis that the above identified low tax states are indeed attractive, we take a look at how domestic migration played out in recent years. As a percent of state populations in 2017, we look at the proportional net internal migration numbers and use this statistic as a proxy for how people either flock to, or flee from individual states. Here are the results

Chart 3: Low tax states attract population inflows

Perhaps not surprisingly, our ‘attractive’ states (in red text) invariably saw net domestic migration versus the high tax states (purple text) seeing outflows. So our top 3 states (from Chart 2) are also states here with the highest population inflows (Nevada, Florida, Tennessee), whereas the bottom states also saw meaningful outflows (Maryland, New York, and MA).


Housing price to income ratio

To add icing on the cake, cities from some of our top states also appear on the cheapest housing market list – according to the 2022 Numbeo home price to income ratio rankings, the good affordability cities (ie with low multiples and high rankings) seem to feature our top states from the foregoing analysis, while the reverse seems to be the case for the expensive cities. In the chart below, the number in brackets after the city is the ranking number out of 40, and the colouring follows the same scheme we have used in the earlier charts:

Chart 4: Home price to income ratio – affordable tax states also have affordable homes?

This may sound too good to be true, but if the trend of continuous inflows persist, perhaps the cheap home price states will not stay cheap for long…


The author would like to thank Jasper Tan Cheuk Him from The University of Hong Kong majoring in Economics and Finance for assisting in data collection, analysis, and drafting of this article.

2022年9月20日星期二

Reiterate UK sell – prospects dimming fast 20220920

Since our 13th May bearish call on UK property, things have not improved on any front, and in this report we update some important macro factors that have either added or worsened the property headwinds the UK is facing. We urge investors to speed up their disposals before it is too late to do so.

Several of the key factors impacting the outlook of UK, and in a sense Europe at large, continue to play out and the current lull (helped by both summer warmth and a temporary correction in energy prices) may reverse unexpectedly when winter arrives. Here are what could happen:

  1. Energy starvation undermines livelihoods, triggers civil unrests?

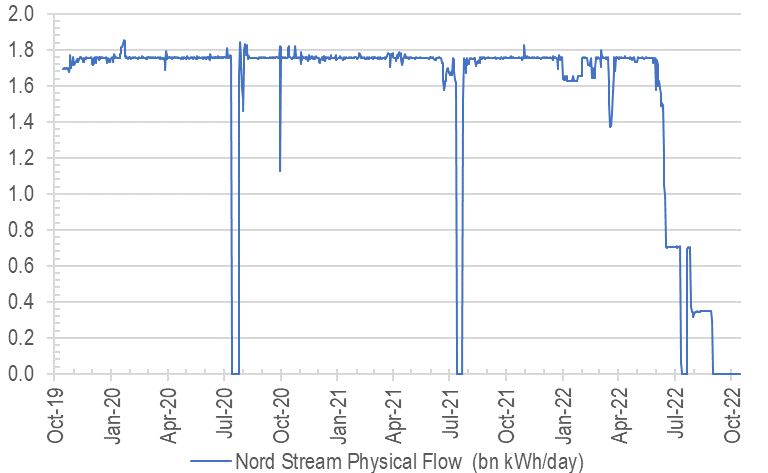
The unfortunate situation Europeans find themselves in can best be described as  a combination of: a) political grandstanding in Ukraine where sanctions beget retaliations (energy & food shortage) from its biggest supplier (Chart 1), while b) the zealous embrace of fundamentalist ‘green’ energy policies without having backup plans worsens the hardship that can potentially explode on to the scene.

Chart 1: Nordstream gas turned off – is it lights out for Europe? Source: Nord Stream AG

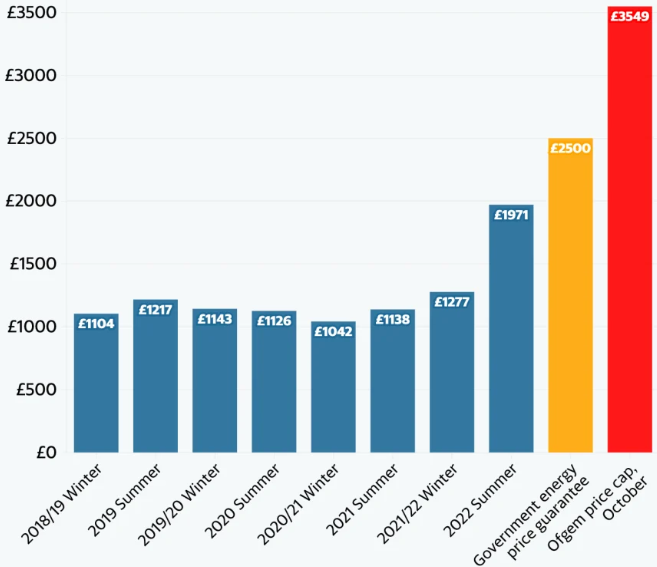
Focusing just in the UK, our subject market, where 40% of electricity is generated from natural gas in 2021, the energy bills for households and businesses are going vertical (Chart 2). An outcome that would have been avoided if the UK did not gleefully hitch the joy ride that expansionist/hawkish US / Nato policies brought about when diplomatic solutions have been in place since 2014 (ie the Minsk Agreement brokered by France and Germany).

Chart 2: UK gas prices tripled vs a year ago

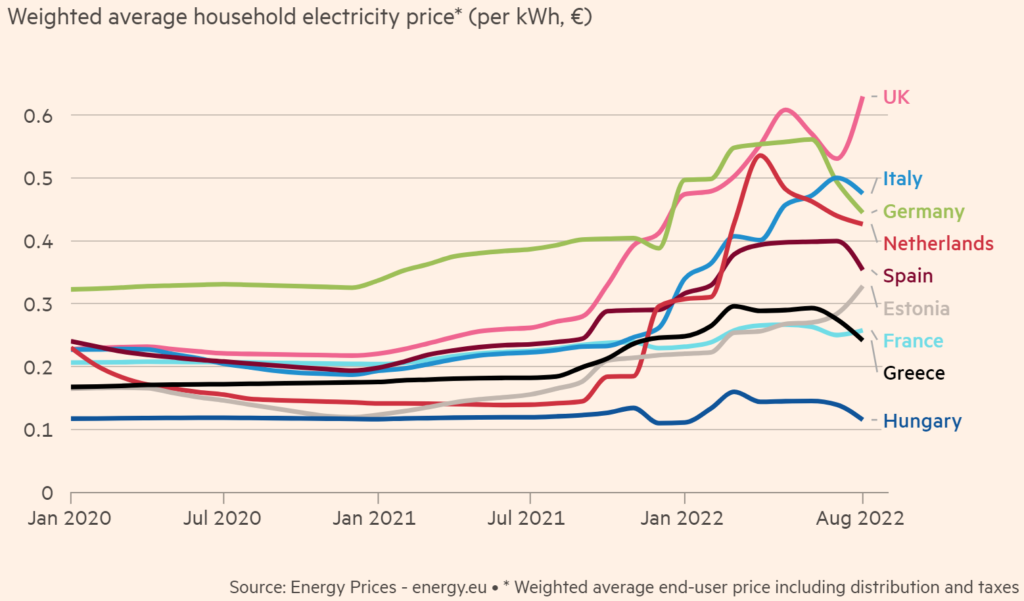
Chart 3: UK electricity price highest in Europe

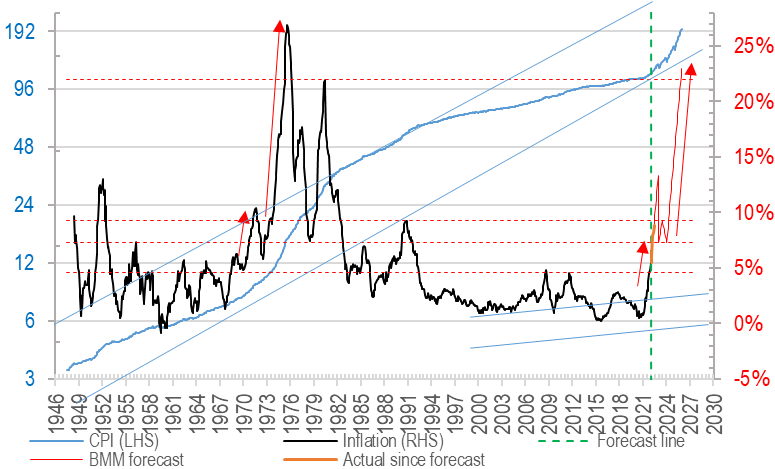
Now European countries not only have to suffer manufacturing stoppages due to energy shortage, but also issue even more debt to relieve household energy hardships at a time when cost of funds are exploding (more below), all while spend unnecessarily on a costly arms race in an unnecessary war which benefits mostly foreign (ie US) energy and munitions producers. This is as close to a perfect storm as it gets, coming on the heels of devastating lockdowns that has destroyed the SME sector in the past three years and ushered in record high inflations (also expanded later, Chart 3) even before the war began…

Chart 4: UK inflation: tracking the the crazy 70s inflationary cycle?

2) Interest rates bursting out of CB control

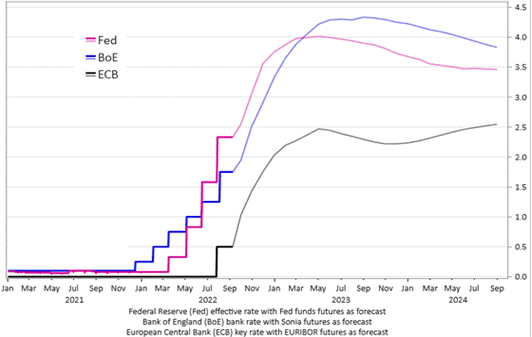
As the Fed aggressively pursues neutralising rates after years of QE, the rest of the world is dragged along with it, with many EM countries flirting (if not already in) double digit interest rates territory. In the UK alone, it is widely expected now some 250bps of hike is on the cards by Q3 2023 (Chart 5), we fear that might appear mild if the sovereign debt crisis worsens.

This will force a repayment crisis for any home owner on high LTVs who will already be seeing their disposable income drop due to high inflation.

Chart 5: Central bank rates in the west projected to hike
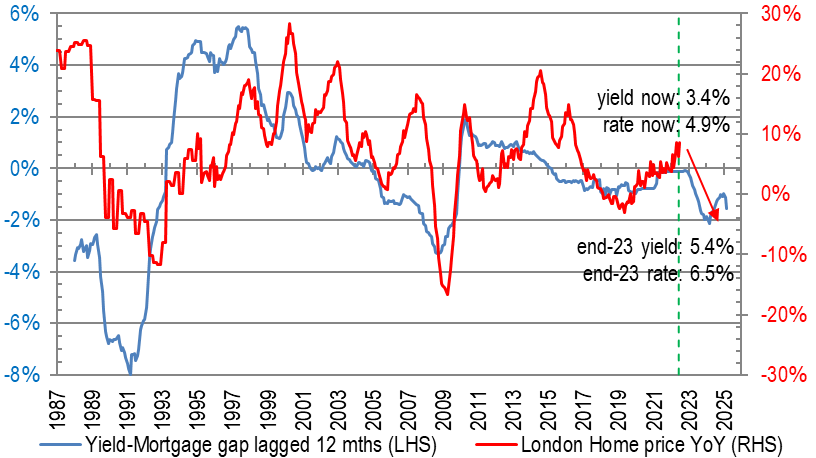
Chart 6: rental yield lagging mortgage – negative for prices

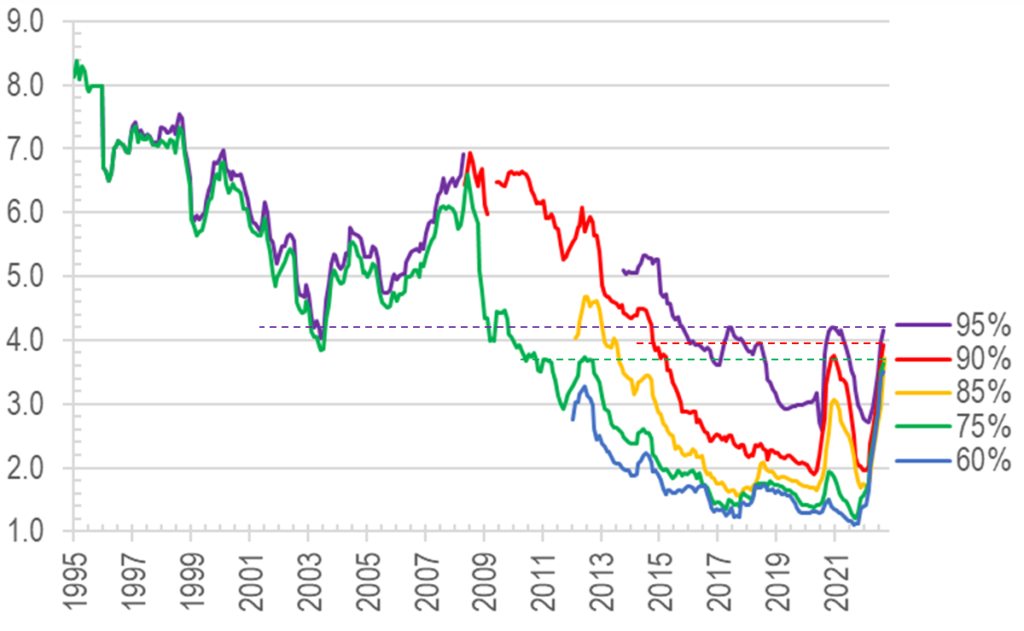
As a result, property yields will have to rise either through big rental hikes (eg in Chart 6 above, c.60% if prices were to stay flat) or some meaningful price corrections heading into 2025. This hike in funding costs will hit even owner occupiers (who may be less concerned with yields discussed just now), as their repayment instalments have only just taken off, and could see multi-decade highs ahead, here is a taste of the rapid ascent and what it looks like:

Chart 7: UK mortgage rates by LTV levels - variously at new highs since 2002-2015

3) Economic shrinkage unavoidable? Unrest/war wildcards on top…

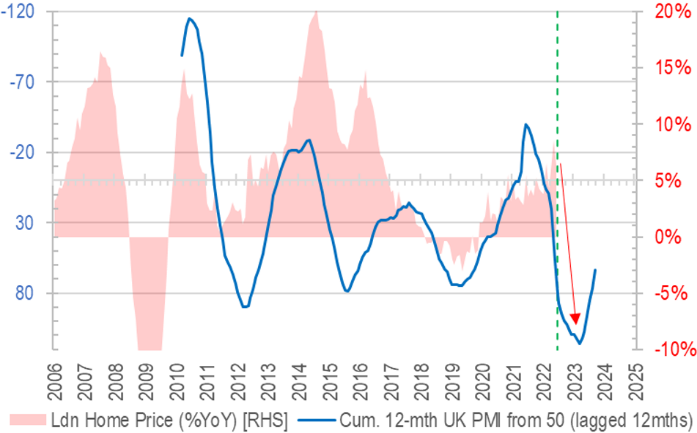
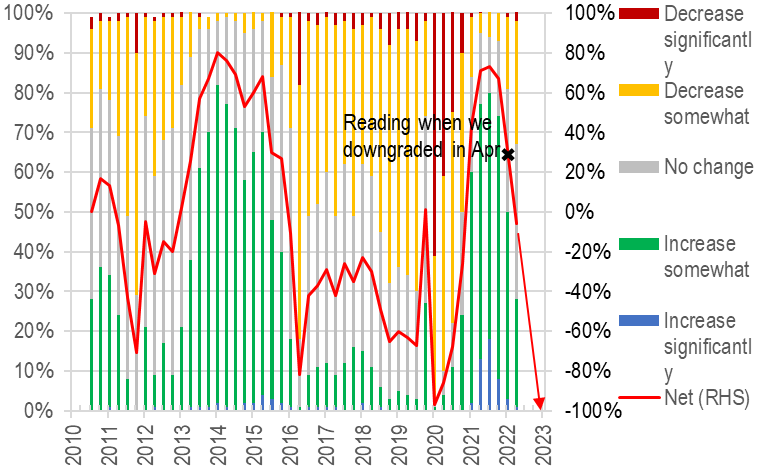
Given the set up of these very unpalatable cocktail, it is unsurprising that our sentiment momentum tracker is suggesting price drops into H2 2023 (Chart 8) and finance directors are getting more bearish (see Chart 9 – again, we expected weaknesses ahead back in May, but this may persist for a few more months to come), which can spell trouble for investments and consumption ahead.

Chart 8: Fast dropping PMI bodes ill for home prices
Chart 9: CFO survey – weak sentiments weakening further

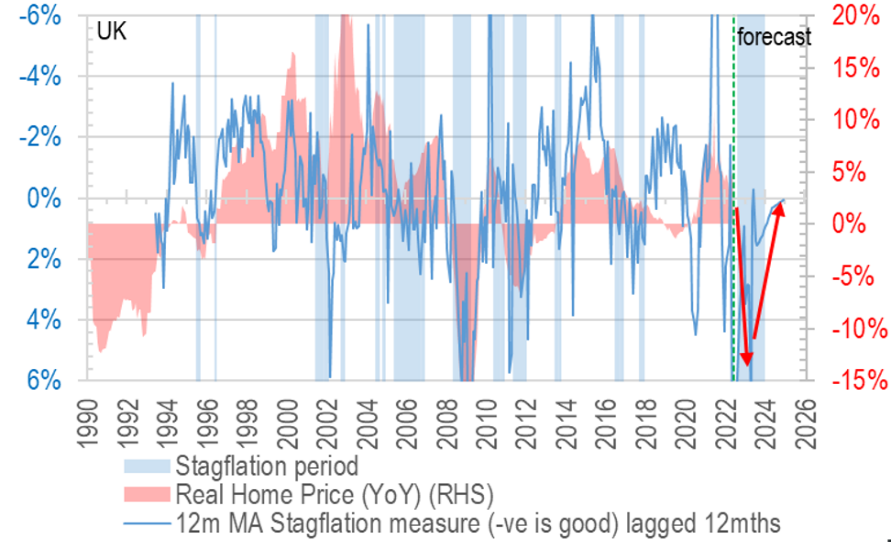
To put all of these indicators on one consolidated view, it is helpful having our ‘stagflation chart’, which encapsulates both the expected weak (if not negative) household income growth and rising unemployment, we see a lot of downside risk indeed:

Chart 10: Stagflation flags point to real home price to fall in 2023-24

4) The weaker the GBP, the more imported inflation – a vicious cycle?

On top of the lacklustre macro picture overall, the currency headwinds are not to be overlooked either – as UK suffers the multiple disadvantages of wrong geopolitics and woke/green misadventures, less investment will head for the British shores, or if there were fleeing EU money, they may bypass the British Isles this time and head straight for the USA instead.

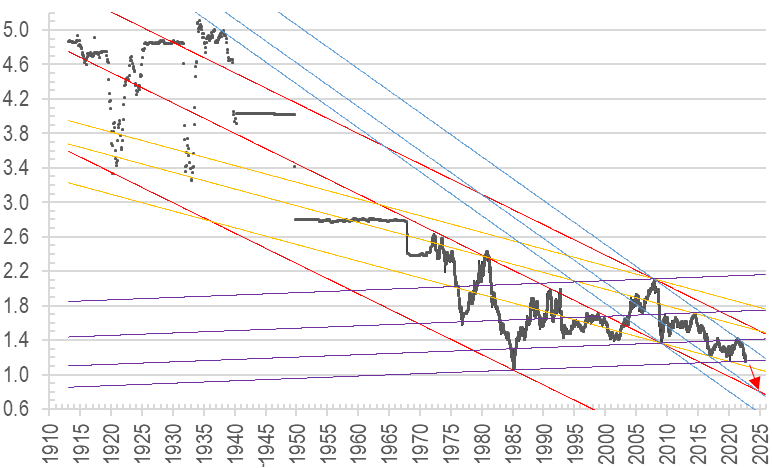
What this means is that, especially for foreign investors (which is everyone buying UK property from HK), more currency losses are possible on top of price drops in local currency terms. In fact latest falls in GBP has broken a long term support level that hs held since the 1980s:

Chart 11: GBP could fall another 25% by 2025 after piercing long term support

With this major technical breach, we could be looking at the pound reaching 80 cents on the dollar within the next two years, or another 25% devaluation. A familiar Christmas carol paints a serene scene like this:

In the bleak mid-winter
Frosty wind made moan;
Earth stood hard as iron,
Water like a stone;
Snow had fallen, snow on snow,
Snow on snow,
In the bleak mid-winter
Long ago.

Let’s hope this scenario does not come true this winter…and the politicians will have the wisdom to reverse so many bad policies that could result in just such a bleak mid winter indeed.

2020年12月9日星期三

BNO to boost UK property, but which area benefits most? 20200905


BNO to boost UK property, but which area benefits most?

Since the imposition of the new national security law on HK from July, immigration enquiries have surged (Chart 1), while at the same time a number of foreign nations have also offered eased passage for Hongkongers to either emigrate to, or seek refuge in (see Table 1).


Chart 1: Google search of ‘emigration’ steadily rose since 2003, surging with 2014/19 protests, then hit record high with national security law


Table 1: immigration schemes announced by various Western countries targeting HKers


In this issue, we take a more granular look at how Hongkongers may impact the property market when they resettle in England (more complete data than Scotland/Wales/NI!), and from there the possible marginal impact this will have on prices.

If HKers distribute as current British Chinese in England

There are many ways to estimate where HKers will set up their new homes in the UK, for example, by income strata (but there is no easy way to get this data for BNO passport holders), or simply by how native ethnic Chinese are already distributed in the country (where census data is readily available).

The latter approach may have a skew towards country living, as more local Chinese may have already integrated into small, even rural communities, which may be harder to do for new arrivals; or there may also be a higher mix of restaurant trade operators across England which raises Chinese numbers in smaller population centres vs big cities which presumably new HKer arrivals would prefer.

In any case, here are two useful views of how ethnic Chinese (a large proportion would be from Hong Kong) are distributed within England:

Chart 2: ethnic Chinese as % of total population in county - highest in Inner London


Chart 3: The biggest cohort of ethnic Chinese also lives in Inner London 


We can infer a lot from the above numbers:

a)       if 10% of the eligible HKers migrate to England, ethnic Chinese will go up by 300k from currently 433k, or a 70% increase;

b)      racial tension might emerge if all 3m of the eligibles make the move – as Chinese weighting spike from 0.7% of total now to 1.2% - a big jump indeed;

c)       assuming the HKers will enter England in the same proportions as ethnic Chinese currently are distributed (Fig 1 below) – which makes sense, as the current pattern already reflects the still largely ‘Hongkonger preferences’ in living in a Western host society – then some cities/counties/regions will inevitably experience more stress to their systems, from housing demand to infrastructure burden, to service requirements. Let’s now look at the housing side of the picture.

Figure 1: % pick your destination based on concentration of compatriots!


Housing shortage most severe in London, Hampshire, Nottingham?

Upon arrival, the 300k HKers (allocating in same distribution as localised Chinese) will likely go for the existing vacant dwellings first, resulting in undersupply (any dot in Chart 4 with y axis value over 1) in Hampshire, London, and Nottingham:

Chart 4: new BNO demand vs existing vacancy – London, Hampshire, Nottingham most stressed


Chart 5: factoring in 2 years of supply, London / Nottingham / Portsmouth are the most stressed districts


The situation is somewhat relieved if we factor in two years of supply likely to reach market (assuming 2019 net completions can be sustained in 2020 and 2021). The result in Chart 5 follows a similar pattern, with the most overwhelmed districts being London (dots 2 & 3), York (dot 4), Portsmouth (dot 14), Nottingham (dot 7), – in that order.

In reality, significantly more than 10% of the eligible HKers may opt to take up the BNO offer, resulting in a maximum 6.7x reading on the demand:supply ratio (instead of 0.67x) for Inner London for example. This could indeed send the hotspot districts’ prices sky high indeed…

To put all of the above discussions in one concise table, here are all the details of Chart 4 and 5 laid out for the top 30 popular districts:

Table 2: Quantifying BNO housing demand


Other relief valves for the UK property market?

Whilst the prospect of a tsunami of Hongkongers could seem daunting at first, some other possibility may reduce such pressures – amongst them are similar migration offers made by other governments (Table 1 above). There is even the idea of ‘international charter city’, set up specifically to take larger numbers of HKers – by locating in a kind of a ‘Special Administrative Region’ that Hong Kong itself is now – the new city may even have its own tax regime and regulations.

It is almost like having a new ‘One Country, Two Systems’, but instead of being at the southern tip of China, it is moved to somewhere else in the world. For background reading on this concept see here (Chinese, more details) and here (English).

Whatever the outcome, it seems our UK strategy, which benefits from both infrastructure lifts specifically, and Brexit more generally, could see a most unexpected, and perhaps meaningful upward jolt in returns from the HK situation?