When dining out, will you head for Ladies’ Market/Temple Street or Langham Place/MOKO? What about choosing between Tang Lung Street/Yiu Wah Street or Hysan Place/Time Square? The answers to these questions hint at the preferences in the shopping for the highly fragmented but competitive market on the one hand, and a curated but selective offering on the other. This phenomenon in Hong Kong’s retail landscape is the result of how the government approaches land sales in recent years: the creation of ever larger shopping complexes while premise choices for end users (i.e. retail operators) diminish.
This hypothesis appears to be corroborated when plotting the stock of retail Gross Floor Area (GFA) in the past 20 years and what market share is made up by the portfolios of the seven major developers (referred to later as the “major players”, including Sun Hung Kai, Henderson, Cheung Kong, Sino, New World, Hang Lung, and Swire): as shown in Chart 1, the major players’ weighting has been steadily rising year after year, except for 2006, when there was a large completion in the overall stock which lowered the ratio, and 2011, when Swire sold Cityplaza leading to a drop in the ratio:
Chart 1: Major players’ share of retail space has been steadily rising

The seven major players have seen their share of Hong Kong retail GFA from 23.8% in 2001 to 25.8% in 2022, and this rise has been accompanied by a meaningful increase in overall retail inventory (which grew by 26.5 million sq ft, or 27%, to 125.9 million sq ft).
Bigger land sites benefit large developers in land sales
Why can the major players acquire increasing shares of retail lands? Is it because there are fewer and fewer small property developers? Or is it because the rising complexity of retail property development is becoming so intimidating that even new large developers from the Mainland – who have been making waves in HK recently – opted to stay on the sidelines?
A look at the long-term trend of the size of land lots sold provides a possible explanation: from 1990 to 2022, the average floor area of pure commercial sites sold by the government has been progressively rising, doubling from 300,000 sq ft levels in 1991 to 600,000 sq ft in 2022 (see blue line and blue dotted line in Chart 2). On top of that, the highest average floor area of commercial sites sold was also reached in 2019, at 1.6 million square feet:
Chart 2: The expanding size of commercial land sold, coupled with rising property prices raises entry barrier to prohibitive levels

Meanwhile, as retail property prices climb, the capital investment required from developers escalates even faster (see red and red-dotted trend lines in the chart above), making it difficult for small developers to compete, thus allowing the major players to build their retail empires.
Moreover, even if we adjusted the red line by the Hang Seng Properties Index (HSNP) to factor in funding capabilities of listed developers, the same conclusion can be reached: the ever growing size of land parcels sold increasingly disqualifies even small listed companies, as the market cap adjusted development capital soars at a exponential rate (green line/green dotted line).
Well-known and old brands more likely own their premises
This trend of retail space increasingly concentrated in the hands of major players seem to be the result of years of government land sale practice. Even if this outcome is not official policy, the objective result is that small shops are excluded from owning their own premises.
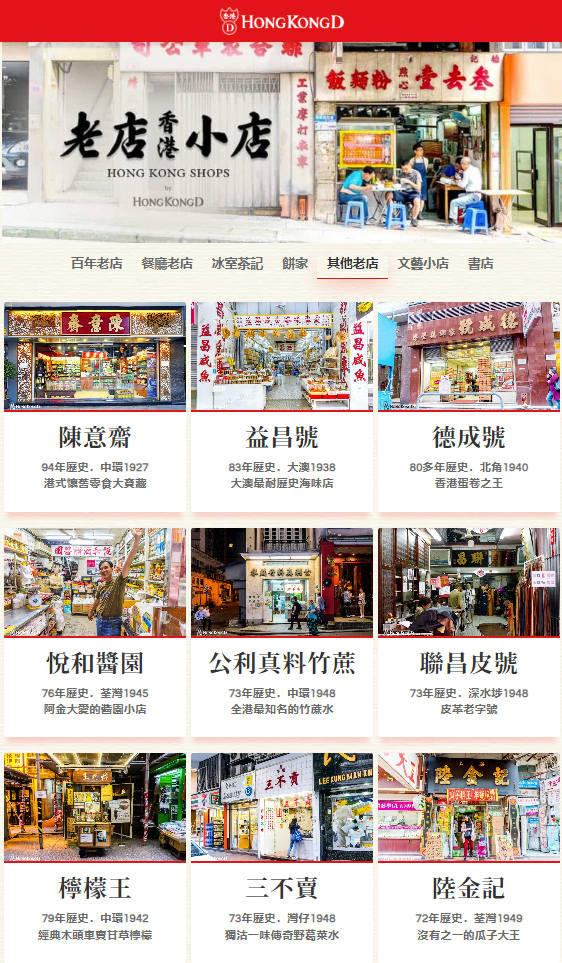
Imagine that land sale conditions stipulate that certain portions of retail sites must be sold as strata title, would that help create a community alive with innovative brands or specialty shops which do not have the pressure to maximise revenue in order just to pay their monthly rent? Assuming such shops need 1,000 sq ft of floor space each, and given that a 560,000 sq ft of floor space has been sold annually by the government (blue line in Chart 2) over the past 30 years, could we have helped at least 170,000 entrepreneurs realise their creative ambitions, and generate long-term wealth through the development of unique products and brands? Figure 1 and 2 are good examples of how rich and diverse (though not necessarily super profitable) brand fabric in Hong Kong’s commercial past may have indeed grown from the soils of pressure free premise ownership:
Figure 1: Century-old stores mostly own their premises outright

Figure 2: Other historic stores also rarely seen in major shopping malls
Mega mall proliferation breeds endless chain brands
The result of the increasing prevalence of large shopping malls alongside retail property ownership concentration not only makes it hard for small specialty stores to compete, but creates a retail scene dominated by well-known chain stores and an almost universally homogenous shopping experience. Let us quantify this issue with some charts:
Observation 1: The larger the average size of shops, the higher the degree of brand duplication in the shopping malls. Chart 3 correlates the distribution of brand overlap between seven pairs of shopping malls (all are leading Hong Kong malls in various categories: e.g. New Town Plaza in Shatin as a community mall, or Langham Place the destination malls group) and the average shop size; remarkably, the bigger the average shop floor area, the higher the overlap tenants between the pair of malls:
Chart 3: Brand duplications is closely correlated with the average floor area of shops within each mall pair

In the community malls group (44% for YOHO malls and Shatin New Town Plaza, Chart 4), probably due to these malls serving sizeable local populations with more homogeneous consumption patterns, they attract largely similar brands as tenants.
In the luxury shopping malls group (43% for International Finance Centre at Hong Kong Station and The Elements at Kowloon Station), again, serving high-end luxury clientele who buy largely similar brands such as Louis Vuitton and Gucci, limiting the variety of tenants these malls can choose from!
At the other extreme sits the group of highly strata titled malls (at a shocking 1% brand overlap, this group is paired between Sceneway Plaza in Lam Tin with a highly fragmented ownership profile and New Town Plaza, a single ownership mega mall); the former has had very dispersed ownership for a long time, and the stores inside have further been subdivided to tiny sizes (at average size of about 800 sq ft, it is 80% less than those of New Town Plaza coming in at 4,770 sq ft), no wonder Sceneway Plaza has very high footfalls, and has a very thriving vibe one finds in open bazaars:
Chart 4: Strata titled malls have more shops and more variety, leading to less repetitive shopping experience

In conclusion, whether we desire dispersed wealth among the populace (as small shop property owners) or strong autonomy of the retail outlets, or increasing choice and affordability for the shopping public, perhaps the government should give consideration to the economic and social benefits of strata title retail ownership after land sales, instead of just planning convenience and procedural expediency from a bureaucratic angle?
Aside from these micro benefits, having greater economic resilience and diversity, as well as enlarging the middle class are potential further benefits of the government cutting up land sale lots and adding a mix of strata title into its sale mandates. The final added reputation bonus would be less perception that there is some sort of ‘land collusion’ game going on in the HK property market.
The author would like to thank Tang Chin Chung from The University of Hong Kong majoring in Surveying for assisting in data collection, analysis, and drafting of this article.


